Technical analysis, done properly, can put the odds overwhelmingly in your favor, but it cannot guarantee a winning result, so always remember to have a stop-loss in, writes Greg Capra of Pristine Capital Holdings, Inc.
You’re scanning your interest list of charts and making a list of symbols separated into minders of uptrends, downtrends, pullbacks, retests, etc. From those lists, you look for the various setups within your trading plan, and you come up on one that you’ve seen countless times, and it’s as close to a sure thing as it comes. Well, I came across one of those about a week-and-a-half ago. What happened is…
Trading with the trend is always the highest-odds play, however; counter-trend setups have their place at the right time. One of those “right times” set up in the Dow Jones Utilities Average (DJU), many stocks within that average and/or stocks and ETFs related to the sector. You may have spotted them. For a counter-trend play, it had multiple technical concepts coming together that suggested the setup had to work out and it started to, but you just never know. Let’s review it.
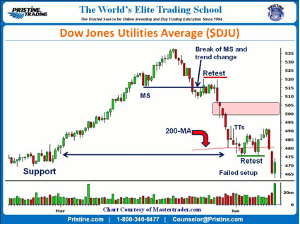
Chart of DJU
The break below major support (MS) in May signaled a change in trend and that the odds of lower prices were high. However, shorting after a sharp drop like the one seen requires a setup that provides an entry point and reasonable reward-to-risk. Retest patterns are a favorite since sellers have “created a new area of resistance” that should not be overcome if the trade is working, of course.
From the retest, prices fell hard and fast. It was what we refer to as a “fluid move” that creates a “price void.” These types of moves leave little-to-no-overhead resistance, so prices tend to retrace back up to price resistance with relative ease. Typically, prices will not retrace the whole drop that occurred, but enough of it to make for an attractive trading opportunity.
This fluid move lower stopped right where it should have. It was text book. Price support was to the left and the 200-day moving average was in the same area. Pristine students learn that moving averages are subjective reference points of support and resistance. However, widely followed moving averages like the 200-MA on the daily time frame often become a self-fulfilling prophecy.
The initial reversal was retested and the reversal that formed on the retest was a larger green candle that even occurred with an increase of volume. It doesn’t get much better for a counter-trend play. The combination of concepts coming together should have/could have moved prices to the red area on the chart where those candles were overlapping. It didn’t happen. Prices stopped at the topping tails (TT) just to the left and then the setup failed completely.
I could have shown you many setups virtually the same as this one and how they moved higher for large profits. Technical analysis, done properly, can put the odds overwhelmingly in your favor, but it cannot guarantee a winning result. Educated investors and traders know that it’s an odds game, and even with the odds in your favor, you just never know. So have that stop-loss in!
By Greg Capra, President & CEO, Pristine Capital Holdings, Inc.


