Even though the market exhibited schizophrenic behavior last week, it is still up 16% for the year, and MoneyShow's Tom Aspray makes the technical case for why a deeper correction might be just what the doctor ordered.
Stocks were hit by a wave of news last Thursday, ranging from weaker-than-expected earnings and better-than-expected data on jobs and housing, which triggered a sharply lower opening in the stock market. The weekly close below the past five-week lows in several of the key market averages is consistent with a near-term top formation.
This drop was not surprising as the market internals early in the week suggested that the market was ready to catch a “summer cold” if not something worse. There were also warnings from the bond market as some of the largest bond funds completed bear flag formations early in the week. This was a clear sign that rates were again ready to move higher.
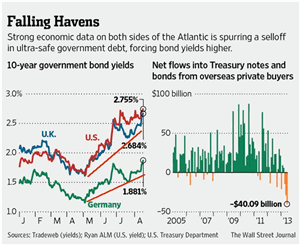
Of course, the trend of higher rates is a global phenomenon as this chart shows the rise of both the United Kingdom's and Germany's bond yields from their spring lows. This has been accompanied by net outflows from the Treasury market of over $40 billion. This is in contrast to the large inflows that had been the normal each year since 2004.
Over the past few months, there have been signs of improvement in the Eurozone stock markets as they had been badly lagging the US for the first half of the year. For example, the German Dax was basically flat from January through the latter part of April while the US market was moving sharply higher
The economic data has now started to confirm the improvement in the Eurozone as last week it was reported that their GDP has risen to 1.2%. This is the first positive-territory reading since late 2011.
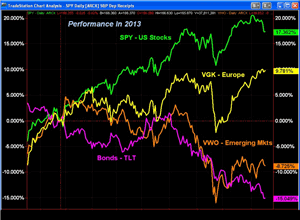
The Percentage Change chart shows that while the Spyder Trust (SPY) and US stocks are still outperforming, the Vanguard FTSE Europe ETF (VGK) is now up 9.6% for the year. It was in negative territory as recently as late June. I will be looking for a correction in the euro-focused ETFs in the next month.
The emerging markets are still lagging badly as the Vanguard FTSE Emerging Markets (VWO) is still down 8.6% this year, while the big loser has been the bonds as the iShares Barclays 20+ Year Treasury Bond ETF (TLT) is down over 15%.
NEXT PAGE: What to Watch
|pagebreak|
For the past three months, the sentiment for US stocks has been uniformly positive and now that the Eurozone also appears to be coming back to life, the long side of the equity markets is looking quite crowded to me.
That is why a period of uneasiness over Fed tapering, the debt ceiling, or a government shutdown is needed to dampen the current enthusiasm for the stock market. A correction would relieve the market's overbought status. If the market does not see more than a 5% correction, I think it will weaken the technical outlook.
A deeper correction may be needed to create enough doubt about investing in stocks to power another sustainable stock market rally that should last until the end of the year.
The economic data last week was not as strong as most expected and this could also help reduce the bullish sentiment as stock prices seem to be pricing in a much stronger economy.
Last week's Retail Sales data was disappointing as were the earnings of some of the big retail names. Macy's Inc. (M) dropped sharply last week and reached good support and my first buying zone. Typically, retail stocks, including department stores and retail apparel, are very strong in the 4th quarter of the year.
Last Thursday, the Empire State Manufacturing survey, Industrial Production, and Philadelphia Fed survey were all weaker than expected. Then on Friday, the preliminary reading on consumer sentiment from the University of Michigan came in at 80 while most were looking for 85. We may see more data like this in the coming weeks.
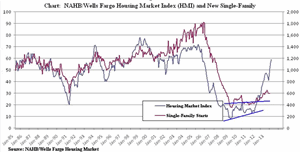
One bright spot last week was the housing market as the Housing Market Index rose to 59, which is the best reading since 2005. Housing starts last Friday also rebounded 5.9% and from a technical perspective, both of these trends still look very strong as the chart indicates.
The homebuilding stocks have been declining since May but rebounded last week. This could be an early sign that the worst of their decline is over as the volume on the buy side was strong. My recent review of the homebuilders and a key homebuilding ETF outlined some of the key support levels where I will be looking for signs of a bottom.
This week, we get more data on housing with the Existing Home Sales on Tuesday and then New Home Sales on Friday. Also released on Tuesday will be the latest FOMC minutes, which may raise more concerns over what the Fed will do at their September meeting.
What to Watch
The message last week was not to go on vacation without first reviewing your portfolio and Thursday's drop was a further warning. This week's action may be quite important because if the market rebounds and is then hit with another wave of selling, it will set the stage for a deeper decline.
There have been plenty of signs of deterioration over the past month but they often come quite early as one cannot expect an immediate reaction. Last Tuesday's higher close in the NYSE Composite, with more stocks making new lows than were making new highs, was a sign of weakness that does not occur often.
In my review of the key ETFs on Friday, I noted that most reached their quarterly R1 resistance and four came quite close to their R2 resistance.
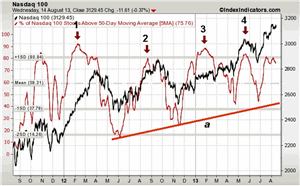
Looking at countless charts of individual stocks, as well as ETFs has made me cautious about the market for some time and the rest of the data is supportive. This chart from Index Indicators, a resource that I wrote about earlier this year, is quite interesting.
This is a plot of the Nasdaq 100 with a five-day moving average of the number of stocks above their 50-day MA (%MA). Let's look at some examples of why I find it a useful tool (the annotations are mine).
The %MA peaked ahead of prices in February 2012, point 1, as the Nasdaq 100 was a market-leading sector. As the Nasdaq was topping in April, the %MA diverged and only made it to the 80 level before it plunged. The %MA formed another peak in August 2012 (point 2) about a month before the Nasdaq 100 and Apple, Inc. (AAPL) both topped out.
There was another high in early 2013, point 3, when the Nasdaq 100 was a lagging market sector. The peak in May (point 4) corresponded with a high in the Nasdaq 100 and was followed by a steep drop in the average. Now, the %MA is back to the 80 level and has formed slightly lower highs.
The important part to note is that the lows in the %MA, line a, coincide nicely with lows in the Nasdaq 100, which makes the risk-reward more favorable for buying when the %MA has dropped at least below 50 and then turns up. This was what happened to the NYSE as I pointed out in late June <https://www.moneyshow.com/articles/GURU-31829/the-week-ahead--Will-the-Rates-Rally-Fizzle-or-Sizzle/?aid=guru-31829&page=3>.
If we get a rally failure this week, it will support a deeper correction. Of course, everyone wants to know how long it might last.
My best guess is a correction could last to the middle of September and possibly after the next FOMC meeting, which ends on September 18. Of course, it could last longer or be over sooner but the short-term indicators like the McClellan oscillator should help us determine when the decline is over.
The recommended strategy is to look for stocks in groups or sectors that bottom ahead of the overall market. Once these stocks reach longer-term chart or retracement support the risk on new longs should be acceptable. Many stocks, like the most overbought Dow stocks I mentioned at the start of the month, have already corrected 4% or more.
The individual investors turned more cautious last week as the bullish % dropped to 34.5%, which is down from 48.9% on July 11. I would like this number to get below 25%. The number of bears rose slightly to 28.2% but it also needs to get much higher.
The financial newsletter writers have been quite complacent as 47.4% are still bullish while the number of bears rose a bit to 20.6%. It may take the threat of a government shutdown or failure to raise the debt ceiling to turn them more bearish.
NEXT PAGE: Stocks
|pagebreak|
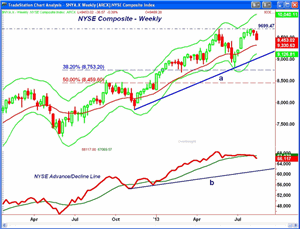
The weekly chart of the NYSE Composite shows that it closed on the lows from four weeks ago. This is enough to cause many of the momentum studies to roll over. There is next support at 9331 and the 20-week EMA while the weekly starc- band is at 9128.
The weekly uptrend, line a, is now at 9023 with the June low at 8814. The major 38.2% Fibonacci support measured from the June 2012 lows is at 8753.
The weekly NYSE Advance/Decline line has been flat for the past six weeks as the daily (not shown) has been acting weaker than prices and is now in a clear downtrend. The McClellan oscillator is around -235, which does favor a bounce over the near term.
S&P 500
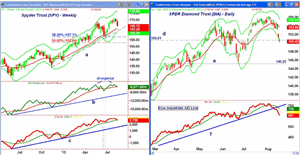
The Spyder Trust (SPY) closed well below the prior four-week lows and below the support at $167.52, which was the late July low. The 20-week EMA is at $163.25 with the weekly uptrend (line a) now at $161.23.
The minor 38.2% Fibonacci support, which is calculated from the November 2012 low of $134.70 is at $157.11 with the 50% support at $152.84.
The weekly OBV is holding just above its WMA but it did form a slight negative divergence over the past six weeks. The OBV has major support at line b.
Both the weekly and daily S&P 500 A/D lines did confirm the recent highs but the weekly is now very close to dropping below its WMA. There is short-term resistance now at $168.28 and the 20-day EMA with stronger at $169.80.
Dow Industrials
The daily chart of the SPDR Diamond Trust (DIA) shows the gap below the monthly pivot at $153.07 last week as it looks ready to close just above the $150 area. The approximately 300-point drop in the Dow last week means that everyone who bought after July 8 is now in the red.
The quarterly pivot is at $149.25 with next important chart support at $145.20, line e. The close was on the daily starc- band so prices are likely to rebound or stabilize over the near term as they are at a high-risk sell zone.
The 20-day EMA is now at $153.69 with the daily starc+ band at $165.44 .The DIA has been weaker than the S&P for sometime. The Dow industrials A/D line has broken its uptrend that goes back to the November 2012 lows. This suggests that it will continue to be weaker than the other market averages.
Nasdaq-100
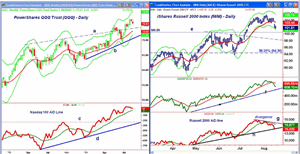
On the weekly chart of the PowerShares QQQ Trust (QQQ), the close last week does not look that negative. There is next support from July at $74.20 with the trend line connecting the 2012 highs, line a, at $73.90.
The still rising 20-week EMA is at $73.01 with the weekly starc- band at $71.83. There is longer-term support at $70.44, line b.
The weekly Nasdaq-100 A/D line broke through major resistance at line c in early March, which was a very bullish sign. The A/D line did confirm the recent highs and is still above its WMA and long-term support at line d.
There is initial resistance now in the $76-$76,30 and a close above $77.20 would stabilize the outlook.
Russell 2000
The iShares Russell 2000 Index (IWM) also gapped through daily support last week as the rally failed just below the quarterly resistance at $106.75 as I discussed in Friday's column. The next good support and the May high is in the $100.50 area, line e.
The daily starc band was tested at the end of last week with the weekly at $97.83.
There is additional support now at $98-$98.50 with the minor 38.2% Fibonacci support from the November 2012 low at $94.36. The June low was at $93.83.
The daily OBV has dropped further below its now-flat WMA. On a rebound, a failure in the OBV to move back above its WMA would be a bearish sign. The OBV has next good support at line f.
The Russell 2000 A/D line has been forming a negative divergence, line g, since August 5 when it failed to make a new high with prices. The divergence was confirmed by the break below the late July low. The A/D line is now well below its declining WMA and just above the support at line h. The declining 20-day EMA is now at $103.43 with further resistance at $104.68.
NEXT PAGE: Sector Focus, Commodities, and Tom's Outlook
|pagebreak|
Sector Focus
The iShares Dow Jones Transportation (IYT) looks ready to close below the support at $114.35, which is the monthly pivot while the June low is at $113.42.
There is monthly pivot support at $110.73 with the quarterly pivot at $109.83. Volume was quite heavy on Thursday's drop.
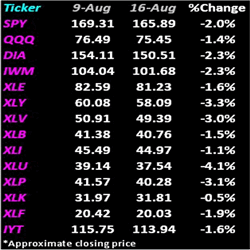
Of the 14 ETFs included in my weekly table, all were lower for the week with the Select Sector SPDR Technology (XLK) and PowerShares QQQ Trust (QQQ) holding up the best.
Two of the worst performers for the week were the Select Sector SPDR Health Care (XLV) and Select Sector Consumer Discretionary (XLY), which I reviewed technically on Friday.
Joining this group were the normally defensive Select Sector SPDR Consumer Staples (XLP) and Select Sector SPDR Utilities (XLU), both down over 3%.
On a further market correction, it will be important to pay close attention to the daily relative performance in order to see what sectors may lead the next rally.
Crude Oil
Crude oil closed the week strong as concerns over the Egyptian situation did not help. The spot contract made it above the $110 level and reached the key level based on the yearly analysis. The daily and weekly OBV are both now positive so they favor higher prices.
Precious Metals
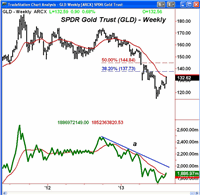
The Spyder Gold Trust (GLD) and gold prices were both very strong last week as they moved above the previous highs. GLD closed back above the quarterly pivot at $129.89. I have been viewing this rally as a bear flag or a rebound in the downtrend.
This is because of the OBV patterns as after such a protracted decline, I would expect to see some positive divergences at the lows but none have formed. The weekly OBV has moved back above its WMA but it is still below its downtrend, line a.
GLD did close below its 20-week EMA with the important 38.2% retracement resistance from the late 2012 highs at $137.73. A close above this level will indicate my analysis was wrong and that a more important low may be in place. If so, there should be another opportunity to buy.
The Week Ahead
The drop last week should have gotten some investors' attention, and if it did not, be sure to keep an eye on the market this week. The technical patterns do favor lower prices, and it would take two consecutive days of sharply higher prices to turn things around.
I raised the stops on many of the positions in the Charts in Play portfolio. For those stocks that look the best longer term, I kept the stops wider as they should continue to do well after a correction. I will be looking at them again this weekend, and I suggest that you do the same with your portfolio.
Keep in mind that there will be a lower risk entry for both the US and European markets in the next month or so, and it will be good to have a high level of cash on hand to pick up the bargains.
In a recent article, It's Never Too Late to Build a Portfolio, I detailed the dollar cost averaging strategy I have been recommending for those who were not in the stock market. I also reviewed a couple of my favorite mutual funds, but commission-free ETFs would also work. The first investment should have been made last Monday with the next on Monday August 26.
There may be a trading opportunity in the inverse ETFs next week, so don't forget to keep an eye on my Twitter feed as I will tweet my new recommendations first.
Don't forget to read Tom's latest Trading Lesson, When Will the Homebuilders Turn Around?
.

