
While many have been dumping emerging market investments in recent months. MoneyShow’s Tom Aspray thinks that continued improvement in the US and Eurozone economies will spill into these markets, and he offers a way to participate in the coming upswing.
It was a rough week for the exchanges as the three-hour halt in Nasdaq trading on Thursday was unprecedented. There was no comment from the Nasdaq until well after the close. On Friday, their response also seemed to be lacking, looks like they must be using the same damage control experts as Carnival Cruise.
Even more disturbing from my perspective was the glitch in Goldman Sachs (GS) options software on Tuesday that mis-priced over 800,000 options at $1 each. If the regulatory authorities decide to bust these trades and protect Goldman, I feel it will be very discouraging to the individual investor.
I agree with Myron Scholes, co-creator of the Black-Scholes option pricing formula, who told the Financial Times that Goldman should pay for their mistake.
The actions of the big institutional traders and research departments can often provide some useful insight. Sometimes, but not always, it is a good idea to do the opposite of what they are doing or recommending.
Click to Enlarge
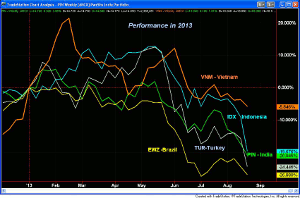
There has been quite a bit of commentary recently on the dismal performance of the emerging markets and the sharp declines in their currencies. Both the Indian and Turkish currencies have plunged in the past few weeks with the Brazilian real hitting a new four-year low.
The chart above shows the performance of five emerging markets in 2013. The iShares MSCI Brazil (EWZ) is down close to 27%, so far this year, with the iShares MSCI Turkey Investable Market (TUR), down over 24%. Another big loser was the PowerShares India (PIN), down almost 21%.
The Market Vectors Indonesia Index (IDX) is not far behind the others as it has lost well over 19%. This makes the Market Vectors Vietnam ETF (VNM) look pretty good as it is down just under 6% and was one of the most recommended markets early this year.
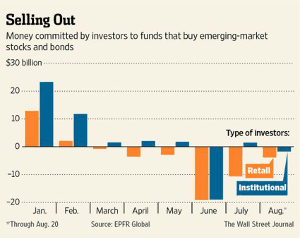
The flow of funds out of the emerging markets has also increased sharply as in June retail investors pulled $18.1 billion out of the emerging markets. This was over 30% of what they had put in since the financial crisis.
Click to Enlarge
I think it is even more significant that the institutions have also been moving money out of emerging market stocks and bonds. As the chart indicates, they were buying pretty heavily in January and February, so I imagine they had some sizable losses. The mixed data out of China has not helped the sentiment and negative stories about their real estate development has scared some investors.
Still, there are quite a few value advisors who see the valuations of the emerging market stocks to be quite attractive. It is my view that continued improvement in both the US and Eurozone economies will eventually spill over to the emerging markets. In Friday’s column, I took a look a three of the largest mining companies, which have also dropped sharply this year. If the emerging markets come back, these stocks should also eventually turn around.
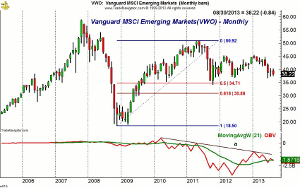
My favorite emerging market ETF is Vanguard FTSE Emerging Markets ETF (VWO), which has roughly 38% in Asian merging markets, followed by 21% in Latin America, and then 18.5% in developed Asian markets. It has a total of 1,037 holdings in a recent report and a low expense ratio of 0.18%
Click to Enlarge
The long-term chart shows that the important 50% support level at $34.71 was briefly violated in October of 2011 when the low was $34.21. In July, VWO formed a doji so a monthly close above the doji high at $40.53 in either August, September, or October will trigger an HCD buy signal.
The monthly OBV needs to break through its downtrend, line a, to generate a major buy signal. Currently the weekly and daily technical studies are both still negative. In the final section of today’s column, I will detail a dollar cost averaging strategy for this ETF. There are several firms, which allow the purchase, but not trading of this ETF, without commission. A 5-10% position in this ETF could pay off well in 2014.
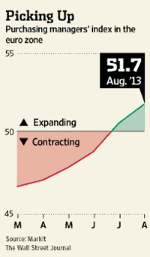
The news out of the Eurozone continues to improve as their Purchasing Managers Index rose to 51.7 in August consistent with an expanding economy. The chart shows a nice trend here suggesting that the worst by indeed be over. A deeper pullback in some of the euro ETFs like SPDR Euro STOXX 50 ETF (FEZ) should create a buying opportunity.
Click to Enlarge
NEXT PAGE: What to Watch
|pagebreak|The US economic data continues to show improvement despite the prior week’s unexpected drop in consumer confidence. The Existing Home Sales jumped sharply, and while the Flash PMI reading was up only slightly, it still shows a positive trend. The Leading Economic Indicators (LEI) from the Conference Board’s Leading Indicators also improved and is in a clear uptrend as I have pointed out previously.
Last Friday’s New Home Sales dampened the rosy outlook somewhat as they were sharply lower, and the prior two months were also revised downward. This hit the homebuilders hard as some were down 2-3%. I reviewed the homebuilders in a recent report When Will the Homebuilders Turn Around? and some are now getting closer to more important support levels.
On Monday, we get the Durable Goods report and the Dallas Fed Manufacturing survey. We get another look at the consumer, Tuesday, with the Consumer Confidence, and also the S&P Case-Shiller Housing Price Index. This will set the stage for the Pending Home Sales Index on Wednesday.
In addition to the jobless claims on Thursday, we get the latest GDP reading. On Friday, the Chicago PMI is released, along with the University of Michigan’s and the final August reading on Consumer Sentiment.
What to Watch
The deterioration in the technical studies that have been developing since early August led to some meaningful selling over the past two weeks. Once again, the major averages closed well above the week’s lows as all except the Dow were higher.
From the high in early August to Wednesday‘s low, the Spyder Trust (SPY) has corrected just under 4%. The prevailing wisdom seems to be that a 5% market correction will be a buying opportunity as the market rallies into the end of the year. However, the consensus view is rarely correct.
So far, the rebound has not been that impressive and therefore suggests two possible scenarios. The first and most bullish case is that the correction is already over and that we will see more serious buying this week. If the market internals are strong, then the divergences we have been noting might be resolved. It is also possible that new highs in the Russell 2000 will not be confirmed by its A/D line.
The second scenario and the more typical pattern would be for the current rebound to fail either at the start of the week or possibly last until after Labor Day. This will result in a drop below the recent lows and would have the potential for an 8-10% correction. This would be enough to increase the negative sentiment, which as I mentioned last week, seems necessary to fuel a more sustainable market rally.
The second is the favored scenario as the daily technical studies are still negative while not all of the weekly studies have turned negative. There are some positive signs as the number of stocks on the NYSE that are below their 60-day MAs did drop one standard deviation below the mean and is trying to turn up. The chart from last week of the moving average of the number of Nasdaq 100 stocks above their MAs, however, is still declining.
Individual investors have continued to get more nervous about the market as the bullish % dropped further to 28.9%, which is down from 48.9% on July 11. It is also encouraging that the number of bears rose significantly from 28.2% to 42.8%
The financial newsletter writers showed less change as the bulls dropped to 43.3% from 47.4%, but the bears rose only slightly to 21.6%
NEXT PAGE: Stocks
|pagebreak|The daily chart of the NYSE Composite shows that the decline dropped below the support at 9415, line a, as well as the short-term 38.2% Fibonacci retracement support at 9351. The daily starc- band is now at 9272 with the 50% support at 9246.
On a longer-term basis, the weekly starc- band is at 9120 with the major 38.2% retracement support from the November 2012 lows at 8753. This is over 7% below current levels.
The McClellan oscillator is now testing its downtrend from the early July highs as it is just below the zero line. Though a move well above the zero line would be a short-term positive, the oscillator would still not show a completed corrective pattern. A drop below last week’s lows could cause the formation of a bullish divergence.
Click to Enlarge
The action of the NYSE Advance/Decline line is much less impressive as it is still well below its slightly declining WMA. A strong close above its WMA and then a slight pullback would be more positive.
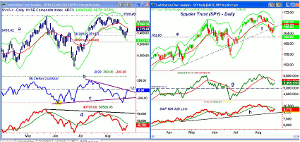
S&P 500
The Spyder Trust (SPY) edged higher last week as the low at $164.19 was well above the 20-week EMA at $163.25. The support from mid-June was violated, with the next support (line e) and the daily starc- band in the $162.60-$162.80 area.
There is stronger resistance now in the $167.18 area, which is the 50% retracement resistance from the highs and the current level of the September pivot is at $167.17. Of course, this number could change once the month is over. The declining 20-day EMA is also at this same level.
The weekly starc- band is at $160.20 with the 38.2% Fibonacci support, derived from the November 2012 low of $134.70, is at $157.11
The daily OBV has turned up but is still well below its declining WMA suggesting that volume on the rebound has not been impressive so far.
The daily S&P 500 A/D line has also not shown much improvement though it is closer to its declining WMA. It has held so far well above the support at line h.
Click to Enlarge
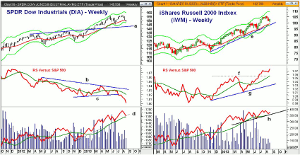
Dow Industrials
The week chart of the SPDR Dow Industrials (DIA) shows that it closed the week below the 20-week EMA, which is now at $150.16. It did close just above the quarterly pivot at $149.25. The lower weekly starc- band is at $147.05 with the longer-term chart support, line a, just above $142.
The relative performance dropped through support at line c in early July indicating that it was weaker than the S&P 500. The RS line shows a long-term downtrend, line b.
The weekly OBV did confirm the recent highs and is acting much better as it is still above its uptrend, line d, and its rising WMA. The daily OBV dropped below its WMA at the end of July, and though it has turned up, it is still well below the declining WMA.
There is further resistance at $150-$150.67 and then at the gap in the $152.10 to $153.11 area.
Russell 2000
The iShares Russell 2000 Index (IWM) held above the support at May high ($100.50) as the low was $100.59. It closed higher for the week, and along with the QQQ, looks the strongest of the major averages. The rising 20-week EMA is at $99.40 with the uptrend, line e, at $98.14.
The relative performance broke out to the upside in early July as it overcame the resistance at line f. It turned up sharply this week. The weekly OBV has also turned up and is above both its WMA and support at line h.
The daily OBV is flat and still well below its WMA as the volume has declined on the rally, which is not a healthy sign.
The Russell 2000 A/D line (not shown) is still below its declining WMA and its bearish divergence resistance. This needs to be overcome to indicate that the correction is really over.
The gap at $101.89 and $104.01 has been slightly filled with Friday’s high at $103.22.
Click to Enlarge
Nasdaq-100
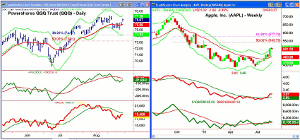
The PowerShares QQQ Trust (QQQ) was the strongest on Friday as it gapped to the upside as the management change at Microsoft (MSFT) gave it an additional boost. It has totally filled its gap with the daily starc+ band at $77.28, which is just above the prior high at $77.27. The weekly starc+ band is at $79.88.
The daily OBV has not confirmed the price action as it did not change much towards the end of the week and it is still below its slightly declining WMA.
The daily Nasdaq-100 A/D line shows a very short-term uptrend but is also below its WMA, which is still clearly declining. The A/D line did not confirm the recent highs and the A/D line is well below its bearish divergence resistance, line a.
There is first support at the rising 20-day EMA at $75.87and then at the week’s low of $75.19. The monthly pivot is at $74.44 with the quarterly pivot at $71.18.
Of course, the rally in Apple Inc. (AAPL) over the past eight weeks has taken it back to the starc+ band, which is at $512 this week. The 38.2% resistance at $503.78 from last year’s high has been overcome. This makes the 50% resistance at $540.79 the next upside target.
There is first good support now in the $465-$475 area. The weekly OBV is above its WMA but is acting weaker than prices as it is below resistance at line b.
NEXT PAGE: Sector Focus, Commodities, and Tom's Outlook
|pagebreak|Sector Focus
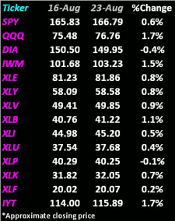
The iShares Dow Jones Transportation (IYT) was one of the star performers last week, up around 1.7%. Though the gains were impressive, the daily OBV is still not convincingly above its WMA. A close above the resistance at $117 would be more impressive.
Of the 14 ETFs included in my weekly table, only the SPDR Dow Industrials (DIA) and the Sector Select Consumer Staples (XLP) were lower. The Select Sector SPDR Technology (XLK) and PowerShares QQQ Trust (QQQ) held up and were strong again last week as they were up 0.8% and 1.5% respectively.
Click to Enlarge
The Select Sector SPDR Utilities (XLU) and Select Sector SPDR Industrials (XLI) were just up a fraction.
The Select Sector SPDR Materials (XLB) were helped by the higher gold prices and were up 1.0%, while the Select Sector SPDR Consumer Discretionary (XLY) and the Sector Select Health Care (XLV) rebounded 0.6% after the prior week’s loss. I am still watching the daily relative performance in order to see what sectors may lead the next rally.
Crude Oil
Crude oil closed the week lower as the drop early in the week preceded the stock market decline as it often does. The daily chart still shows a trading range, which is likely setting the stage for a further rally.
Click to Enlarge
Precious Metals
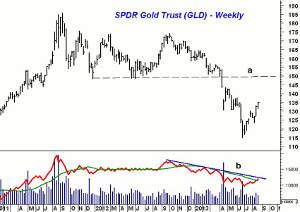
The precious metals were strong last week as the Spyder Gold Trust (GLD) as it gained $2.80 for the week. The weekly chart shows that the OBV has just barely moved above the declining WMA. It is still below the downtrend, line b.
GLD is still below the important 38.2% retracement resistance from the late 2012 highs at $137.73. A close above this level will indicate my analysis was wrong and that a more important low may be in place. This week’s action should be critical.
The Week Ahead
The rebound last week was not strong enough to change the overall technical outlook, which makes the first few days of the week important. One strong down day will indicate a test of last week’s low.
I still think that there are some groups that are getting closer to more important support and could bottom ahead of the market. As I have mentioned for many years, September is often a difficult time for the market. Be sure you have your stops and a plan in place. Keep some powder dry to invest once we reach a more favorable seasonal period later in the year.
I again adjusted the stops in the Charts in Play portfolio, and I continue to advise keeping a close eye on your positions
As for Vanguard FTSE Emerging Markets ETF (VWO), I would divide the amount you want to invest, say 5% of your portfolio, and then divide it into six equal parts. The first should be invested on September 3 and then invest another equal portion every three weeks. This will make you fully invested before the end of the year. Of course, if we get strong new buy signals, I will let you know.
I will be out next week and the next Week Ahead column will be released on September 6.
Don't forget to read Tom's latest Trading Lesson, 5 Rules for Trading Success.


