
Matt Kerkhoff is a leading expert on general market analysis; his money management research is available through his Model Investing; he also frequently contributes to industry-leading The Aden Forecast, including this recent update on the current state of "Dow Theory".
I’d like to provide an update on the market through the lens of Dow Theory. As you know, Dow Theory is the basis of all technical analysis, and has been accurately used to characterize the primary trend of the market for many years.
Admittedly, Dow Theory is not the most efficient tool for short-term market timing, but it does play a crucial role in helping make those types of decisions. This is because even when making a short-term investment, one generally does not want to fight the primary trend of the market.
For example, in a Dow Theory bull market, you may want to refrain from making too many bearish trades. This is because the overall trend of the market is up, and that creates a gravitational pull across all stocks.
Conversely, when the primary trend is bearish, you may not want to place too many bullish bets, because the market as a whole is expected to decline. With that, let’s jump right in and see what Dow Theory is telling us now about the current market environment.
To help guide us, I’ve created the chart below which shows price action for both the Industrials (top panel) and the Transports (lower panel).
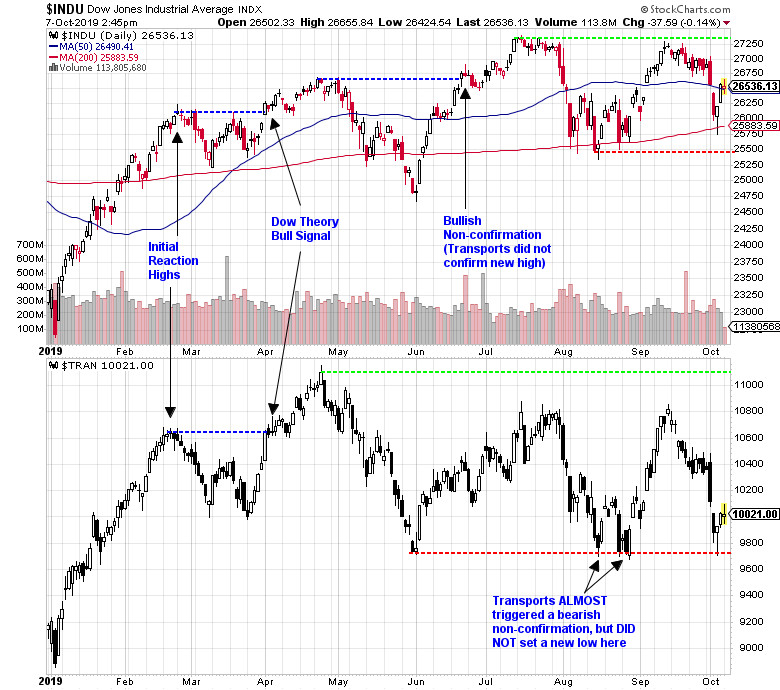
Our story begins in December of last year (not pictured) when both the Industrials and Transports each fell to new lows, thereby triggering a Dow Theory sell signal. When 2019 began, we were technically in a Dow Theory bear market.
As a result, the big rally that we saw to start the year was actually a correction (or reaction) within a broader bear market. Once the initial reaction highs were locked in (see chart above), the bear market would have been reconfirmed by both averages then falling below their late-December lows.
As you can see, that didn’t happen, and after making a failed attempt at new lows, both averages then rallied once again and rose above their respective initial reaction highs. This resulted in a Dow Theory bull signal, as now both averages had transitioned into a pattern of higher highs and higher lows.
The bullish signal that was provided at the beginning of April still remains in effect, but since then, we’ve seen some interesting price action that is again calling the strength of the bullish primary trend into question.
Specifically, in late June, after roughly a one-month correction, the Industrials surged to a new high, while the Transports did not. When one average reaches a new high (or new low) but the other does not, we call this a non-confirmation. In this case, the Industrials signaled that a bull market remains in force, but the Transports did not.
The result is that we are now in a state of bullish non-confirmation, per Dow Theory. This means that the primary trend remains bullish (we always give the benefit of the doubt to the most recent confirmed signal), but we need to remain cautious of an upcoming change in trend.
I’d now like to identify some key price levels and tell you exactly what we need to see for either the bull market to be reconfirmed, or for Dow Theory to turn bearish. Let’s begin with what’s needed for a bullish reconfirmation.
This scenario is easy to outline, because it entails both averages reaching new highs (rising above the green dashed lines in chart above). For that to happen, the Industrials would need to climb above 27,359 and the Transports would need to clear 11,099. Keep in mind that the averages do not need to reach new highs at the same time, as long as they both do so within a reasonable period of time (usually within a month or two).
Now let’s talk about what we need to see for Dow Theory to turn bearish. The Transports never made it back above their all-time high set in April, but they do remain above their initial correction low, set at the very end of May.
As a result, 9,738 (red dashed line in lower panel) has become the line in the sand that the Transports need to fall below in order to set a new low. As you can see, the Transports are not too far above that mark now. Regarding the Industrials, their most recent correction low was set in mid-August, when the index fell to 25,479 (red dashed line in top panel).
If the Industrials fall below that mark, they will have been in a bearish pattern of lower highs and lower lows for nearly three months. That, combined with the Transports falling below 9,738, would trigger a Dow Theory bear signal.
In summary, if both averages rise above their respective green dashed lines, it will constitute a reconfirmed bull market, and if both averages fall below their respective red dashed lines, Dow Theory will turn bearish.
Now that we understand that Dow Theory remains bullish, and we know what price levels to watch for either a reconfirmation of the bull market, or a change in trend, let’s discuss a few other factors that pertain to this conversation.
The main reason why Dow Theory looks at both the Industrials and Transports, is because of the concept of participation. Healthy bull markets almost always involve the vast majority of stocks rising, as opposed to the market being led higher by narrow leadership (a specific sector or small group of stocks).
Another way that we can get a read on market participation is by looking at the NYSE Advance-Decline Line (chart below). This is a breadth indicator which shows whether the majority of issues on the NYSE are rising or falling.
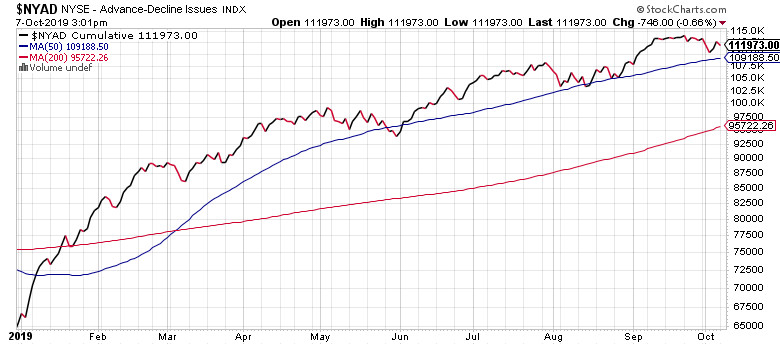
As you can see, the A-D line recently set a new all-time high last month. This is a bullish signal, as it demonstrates that the entire market is rising, as opposed to just a handful of large-cap stocks. Looking at this chart, one can say that the price action of the broader market is in harmony with what we’re seeing in terms of Dow Theory.
The last item I’d like to touch on briefly is interest rates. One of the most important indicators you can watch is the yield on the 10-year Treasury note, which is shown below. The 10-year note yield is the basis for nearly all long-term loans, including mortgages, and changes in this rate can reverberate through the stock market.
Over the last year, we’ve seen the rate on the 10-year note fall dramatically, from above 3% to about 1.5%. This has worked to support stocks prices and valuations for two reasons.
First, since bonds compete with stocks for investor money, when bond yields fall, it pushes investors toward stocks. The yield on the 10-year note is currently below the dividend yield on the S&P 500.
Second, because stocks are valued based on their future cash flow, the prevailing level of interest rates affects the valuation levels that stocks should trade at. When rates are low, stock valuations should be higher, and vice versa. In this environment, the decline in interest rates is helping to prop up valuations, which remain high, but are not stretched.
Overall, the economic and financial environment still remains supportive of stocks. So stay invested, but recognize that we are late in this cycle and that the situation could change quickly.


