
New economic data being released as earnings start to hit may alter how investors perceive the recent price recovery in the US and global markets, explains Chris Vermeulen, chief market strategist at The Technical Traders.
Many institutional analysts began suggesting “the bottom is in” and recently began to issue stronger forward guidance. The new data suggests we are seeing an economic contraction that, in some cases, maybe 2x or 3x the contraction that took place in the 2008-09 Credit Crisis.
We continue to believe a deeper price low will set up in the near future with the US and global stock prices attempting to retest recent price lows — possibly falling below these levels.
We believe the collateral damage to consumer engagement, manufacturing, transportation, retail/leisure, real estate and other sectors of the economy is just now starting to become evident. What the economy may look like near Mid-May is anyone’s guess.
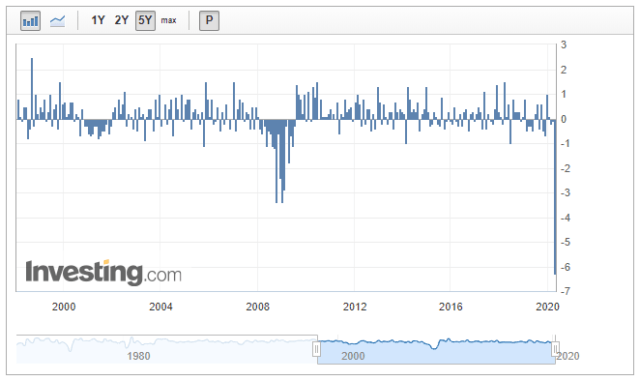
Manufacturing Output Index
One of the most interesting data items published recently in the US Manufacturing Output Index which reported at -6.3%. This is the largest downside (negative) print going back over 20 years. It is nearly 2x larger than the deepest levels from the 2008-09 Credit Crisis and nearly 6x the levels of the 2001 9/11 terrorist attacks. This time it really is different.
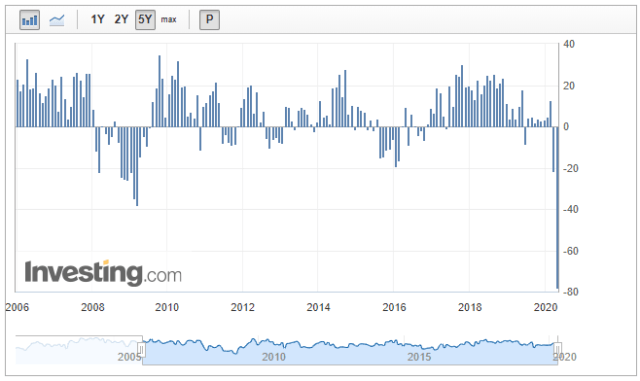
New York Empire State Manufacturing Index
The New York Empire State Manufacturing Index was no different – posting a level at -78.20%. This massive negative number is nearly 2x the deepest levels printed during the 2008-09 Credit Crisis and clearly illustrates how the COVID-19 virus event has disrupted manufacturing output across the globe.
Depressed manufacturing translates into decreased shipping, decreased supply, decreased demand, and decreased overall economic engagement (employment, support services, taxes, and others). A number similar to the lows of 2008-09 would be sufficiently terrible. A number that is 2x below the lowest levels in 2008-09 is absolutely destructive to forward expectations.
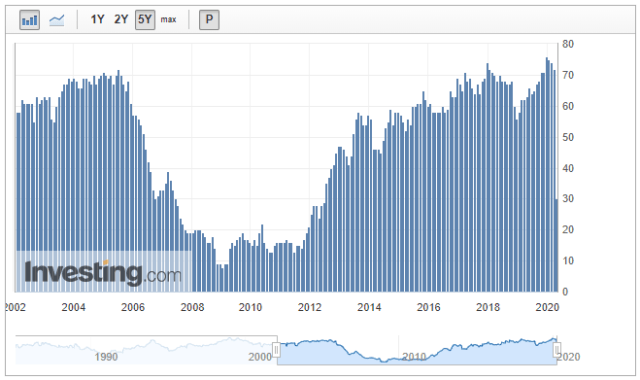
NAHB Real Estate Index
Real estate is starting to feel the pinch too. The NAHB Real Estate Index came in at 30. The only times in history where this level has been reached were September 1990, October 2006, and June 2007. These areas in history clearly point to an early recession indicator in the markets.
We found it interesting that September 2001 (9/11) didn’t experience any major downside print in the NAHB index. The lowest level reached after 9/11 was 46 (November 2001). The current 30 level is shocking. If history is any indication of what to expect in the future, this real estate index may attempt to set up an extended bottom near or below 15 to 20 over the next 12+ months.
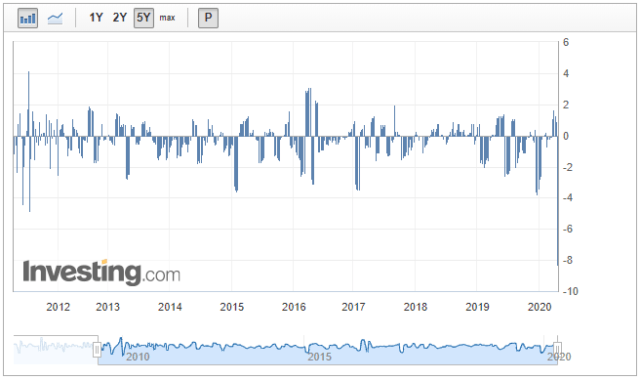
Redbook Index
Lastly, the Redbook Index – which printed a level of -8.3. This index of over 9000 retail locations is one of the broadest market indicators of consumer/retail-based activity in the US.
Obviously, with the shutdown taking place within the US and across the globe, we were not expecting any type of fantastic number. Yet our concern is that consumer engagement continues to slowly emerge from the shutdown over the next 12+ months and the collapse in retail may become prolonged
Historically, this is the deepest level printed on the Redbook Index since 2008-09. We believe the continued shutdown and disruption to traditional manufacturing, supply and retail will continue to present very negative outcomes for global economic measures. Thus, we believe the risks to the US and global stock market are still very real for skilled traders.
Concluding Thoughts:
The US Fed and global central banks are doing everything possible to support a shocked global economy — yet they can’t print enough money to replace the global activity of consumers, manufacturers, and traditional economic functions. They can just attempt to “patch things up” while they wait for consumers and manufacturers to begin operating near-normal levels.
It is very important for skilled traders to understand the bigger economic risks that are at play and to understand the process of price moves within the current market cycle.
Be prepared for more downside risks and a potential for a much deeper price bottom over the next 6+ months. Those individuals/firms suggesting “the bottom is in” are certainly jumping the shark, in our opinion, right now. It’s a pretty big event to come out right now and tell investors “buy these dips because we believe the US Fed has everything under control”.


