
Implied volatility can give such powerful signals about the markets that spotting unusual volatility patterns can be a standalone trading strategy, writes JW Jones of Options Trading Signals.
For the trader trying to understand options, it is important to understand the two different concepts of volatility commonly discussed with regards to stocks and their associated options. The importance of understanding the concepts is that volatility in one of its two forms plays a major role in the seemingly inscrutable machinations of options pricing.
The two types of volatility are referred to as statistical volatility and implied volatility. The first type of volatility has little impact on option pricing and is simply a mathematical expression of the magnitude of price variation of a stock over a historical period. This form of volatility is obviously of historic interest and does not reflect future expectations of future price volatility.
The more interesting volatility measure for an options trader is that of implied volatility, often abbreviated as IV. Taken together with price of the underlying and time to expiration, these factors form the three primal forces of the options world.
See related: The 3 Primal Forces of Option Trading
Since price of the underlying is familiar to all traders, and time to expiration is obvious to anyone with a calendar, the “stealth” component of these factors is implied volatility.
Implied volatility is calculated by solving one of the several available options pricing models for this variable. Since price of the underlying is known precisely and the time to expiration is simple to determine, the equation can provide the implied volatility necessary to produce the current price of the option.
An important characteristic of implied volatility is that it is forward looking and reflects the aggregate opinion of future price volatility for the given underlying. As such, it provides an important insight to help predict the magnitude, but not the direction, of future price movement.
Implied volatility can be ignored only by those option traders with a death wish. As an example of the danger of not understanding the impact of implied volatility, consider the following common story of a trader beginning to trade options.
Thinking that earnings will be strong, he buys a front-month, at-the-money call option looking to profit from correctly predicting price action after the release. Following the earnings release, his call reacts little, if at all, to the price action. Common conclusion: the options markets are rigged and controlled by insiders and offer no potential for profit.
The actual cause of this less-than-optimal trade is a well-recognized and reliably predictable phenomenon that repeats every earnings cycle: implied volatility almost always spikes as earnings approach, reflecting an anticipation of significant price volatility as a result of earnings releases and forward guidance.
As soon as this data is released, implied volatility typically collapses because the uncertainty surrounding this event has been removed. As a result, option prices are significantly lowered, and this collapse in volatility often overwhelms correctly predicted price action and results in a flat or even losing trade.
NEXT: 2 High-Probability Trades Driven by Implied Volatility
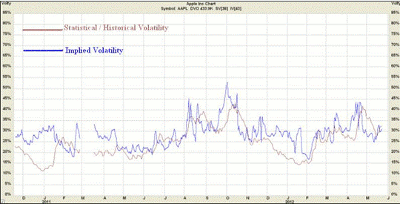
|pagebreak|Most traders are familiar with the fact that the Volatility Index (VIX) is reflective of the implied volatility of the SPX index. What is not generally as well known is that individual stocks have historic databases of their implied volatility.
Consider, for example, the chart below presenting the daily historic and implied volatility for the recent past in Apple (AAPL).
Click to Enlarge
Several things bear emphasis on the chart above. First, this database refers to historic volatility as statistical volatility (SV)…only the names are different.
See also: Historical vs. Implied Volatility
Second, notice that there is no consistent relationship between historic and implied volatility; at times implied volatility is higher than historic volatility and at other times lower.
Third, notice that there are distinct spikes in volatility. In general, these correspond to periods immediately before earnings release.
Other spikes in implied volatility correspond with price decreases. Another reliable characteristic of implied volatility is that it is inversely related to price direction. The explanation for this phenomenon is that when price drops, traders scramble to buy puts and are willing to pay up for this protection.
See related: The Predictive Power of Implied Volatility
As a result of the increased demand, price increases. The mathematics underlying option pricing require parity between put and call pricing, so the price of the calls increase as well.
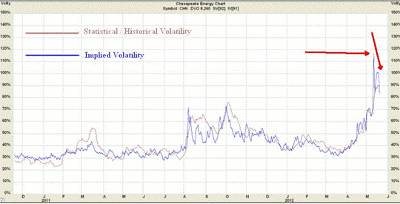
Another typical characteristic of implied volatility is that it has a characteristic range for a given underlying. This tendency can provide high-probability trading opportunities when volatility spikes well beyond its normal range as a result of some event.
For example, Chesapeake Energy (CHK) recently exhibited a sharp selloff. Notice the reaction of implied volatility of its options as traders rushed to buy protective puts.
Click to Enlarge
As a result of this spike in implied volatility, I was able to sell Jun 10 puts, a strike far away from the then current price of $15.29. This trade had a 94% probability of profit at expiration. As price stabilized and implied volatility came down, I was able to close the trade for a 78% realized profit based on the funds encumbered by margin requirements.
Understanding and accounting for the behavior of implied volatility is essential for the options trader. Not to consider this factor in trades is a major error for beginning option traders. In the future, refrain from making this very common mistake.
By JW Jones of Options Trading Signals


