Gold bugs have been in a major funk as the yellow metal remained stuck in a tight trading range since October 2012, but one gold miner is sending bullish signals, notes trader Donald Pendergast of SentientTrader.com.
For confirmed gold bugs, the name Newmont Mining (NEM) is probably one of the first things that come to mind whenever they start musing over which gold mining stock to play whenever the gold/silver mining stocks have been through a tough period of underperformance and bear market stagnation. NEM is one of only two precious metals mining giants in the S&P 500 index Freeport McMoran Copper and Gold (FCX) being the other one], but NEM is of much greater interest to gold bugs because its operations are far more focused on gold/silver mining rather than on copper mining. And with NEM now testing critical support in the 42.50/43.00 range once again (for the fourth time in less than a year), true believers in the gold mining camp may be about to be offered the opportunity to get in on the start of a bullish trend reversal in NEM within the next few weeks of trading action.
Here's a closer look now at a very interesting and very bullish looking daily chart setup on NEM now.
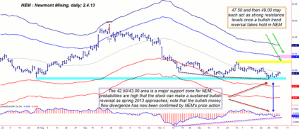
One of the most bullish aspects of NEM's daily Keltner band chart is that the stock has just completed its second test of major support in the 42.50/43.00 area since making a major swing low in July 2012; the stock's most recent swing low on January 28, 2013 also happens to be the third test of that same support area since May 16, 2012.
Clearly, the 42.50/43.00 price level is a support are that the bulls appear willing to defend—aggressively—and this time they appear to be accumulating shares in anticipation of a sustained trend reversal, one that could eventually help the stock recover 50-62% of the losses incurred during the September 2012/January 2013 decline from 57.93 to 42.55. Note the 34-period Chaikin money flow (CMF)(34) histogram and how it tells us that money has been flowing into the stock even as it descended into the recent low; the 100-period Chaikin money flow (CMF)(100) histogram (not shown) is also confirming that the 'smart money' has been quietly buying into the last phase of the decline—presumably in anticipation of making some serious money on the next rally phase in NEM.
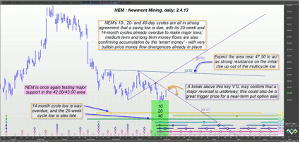
Moving over to NEM's daily price cycles chart, we also find serious evidence that a major reversal may be brewing; the stock's 10-, 20-, and 40-day cycles are all in strong agreement that a significant cycle low is scheduled to appear; in fact, NEM's powerful 14-month and 25-week cycles are both overdue to bottom, making this potential for a strong bullish turn in NEM even more probable.
The final arbiter of whether or not all of these projections will play out as anticipated rests with the daily price action on the chart and not on any technical indicators or cyclical dynamics, and fortunately, we have a terrific confirmation tool plotted right on the chart for this purpose; if there is a daily close above the down sloping trend line (just above the green shaded area) in the 44.80 area, the this bullish trend reversal will have been deemed a 'go,' especially for swing traders looking to capitalize on a swift move up to the next resistance level near 47.50.
The 49.00 area is also likely to be strong resistance, too, but only longer-term traders need to focus on that for now. A fairly low risk put option play right now would be to sell a March '13 NEM $42.00 put option, but only on a break by NEM above the 44.75 resistance level. The $42.00 strike price is well below the major support level previously mentioned, offering a measure of protection for the short put—something you always want to have in place before selling naked puts in a stock or ETF.
If the put doubles in price or if NEM drops below 42.55, simply buy it back at a loss, and if the put declines in value by 50-60% buy it back at a nice profit, being sure to risk no more than 2% of your margin account equity on this or any other stock or option trade.
All things considered, NEM looks like it's ready to break higher, and this put option play might just be able to help snag you a bit of profit on a bullish turn of events in this stock.
Donald Pendergast can be found at SentientTrader.com.


