Given the event-driven nature of the current market swings, it's easy to imagine a huge selloff in volatility as soon as there is any political resolution in Washington, notes Jason Woodard of CondorOptions.com.
Monday's 1.9% decline in equities sparked the largest jump in the VIX since...
There's certainly some value in knowing the end of that sentence, but unless you're avoiding all financial media, you've probably already read a few variations of that story. Here are some additional ways of measuring changes in implied volatility. We use some of these estimates to inform market timing strategies.
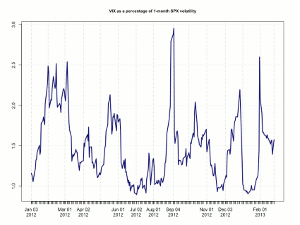
First, here is the VIX shown as a percentage of trailing S&P 500 one-month historical volatility. Sometimes this ratio is referred to as the volatility risk premium.*
With VIX just shy of 19% and one-month SPX volatility at 12%, there is a substantial premium already bid into SPX options over the movement we've seen in the index. However, the current ratio (1.58) is only slightly above the mean value for this estimate since the beginning of 2012 (1.47), so it's quite the opposite of extreme. Even if we use a shorter look-back window, say the last ten days, SPX volatility is just 14%. That means traders who bought put options on Monday will need many more 1% down days in the term to make those contracts profitable at expiration.
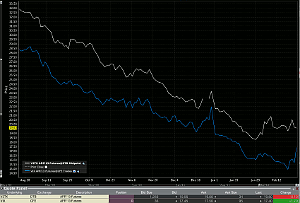
Next, compare the April VIX and VSTOXX contracts. VSTOXX is a European equivalent to VIX, with both a "spot" index and liquid volatility futures. There is usually a gap of a few points between these contracts, but that gap narrowed on Monday by the US close.
It may just be that investors had not decided to jump into long volatility positions en masse by the European close, such that VSTOXX contracts will rush higher at the next open. Alternatively, a lot of the end-of-day volume in VIX futures has been driven for some time by ETN hedging—VXX, UVXY, etc. The VSTOXX equivalent ETNs are apparently not nearly as popular, so that order flow might explain the day's change in this relationship.
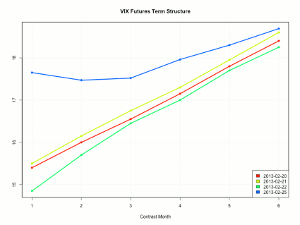
Finally, a snapshot of the last four sessions of VIX futures trading shows that the term structure made a significant move on Monday. The March contract was last offered about 15 cents higher than April.
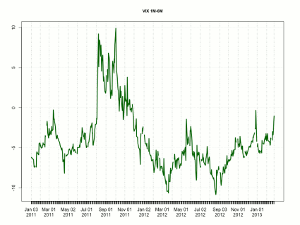
The rest of the curve was still contangoed, and again given the market-on-close/ETN noise we will call this curve backwardated only on a technicality. What's more important now is to look at is the difference between one-month and longer-horizon implied volatility, in this case six months:
As you can see, the last spike in this relationship was in late December during the fiscal cliff talks. Before that, there was a smaller spike in the late spring of 2012 and obviously the large change when the Eurozone crisis came into its own in 2011. A lot of traders look to the ratio of VIX and VXV, which has a three-month horizon, but I find this to be too noisy: spot VIX itself fluctuates so wildly and three-month estimates aren't so anchored that they won't still see a fair amount of noise, too.
In any case, this sort of flattening in the term structure should be taken seriously. You don't trade against this sort of movement; you step aside and possibly let the front couple months backwardate in a meaningful way, taking that as a signal to be long volatility. Given the event-driven nature of these market swings, it's easy to imagine a huge selloff in volatility as soon as there is any political resolution, and with SPX ten-day annualized vol below 20%, we're still obviously talking about trying to dodge the brunt of an ordinary correction, rather than the onset of a recession.
We track indicators like these on a weekly basis in the newsletter, and last Wednesday we advised clients not to enter new short volatility positions based on our short-term momentum signal.
*Strictly speaking, the volatility risk premium should be estimated as the volatility implied for some period and the actual standard deviation of returns we observe over that period. However, we can't see the future, so in real time the next best thing is to compare current IV to the most recent backward-looking observation of historical volatility.
By Jared Woodard of CondorOptions.com


