During periods of high market volatility, it can be worthwhile to own SPX options, otherwise, equity index options tend to be quite overpriced, writes Jared Woodard of CondorOptions.com.
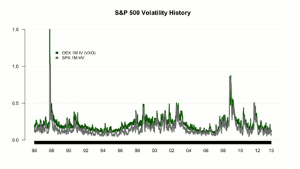
Some clients here and readers on Twitter asked for a long-term look at the relationship between the historical volatility of the S&P 500 and the implied volatility of SPX options. The chart below shows those two-time series since 1986, using a one-month estimate for historical vol and the VXO index for implied vol.*
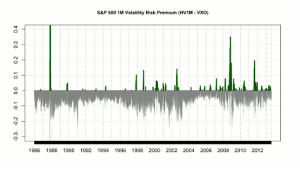
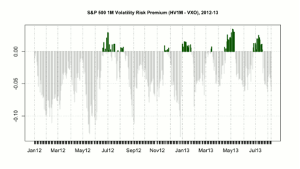
The statistic in which most traders are interested is the difference between those two estimates, otherwise known as the volatility risk premium. It is well known that, most of the time, the difference between the realized volatility of SPX over some period and the volatility implied by options with the same maturity is negative. That is, option buyers typically pay a premium above the “fair value” in vol terms. The following charts show that difference since 1986 and since 2012, with the y axis scaled to a smaller range so that changes are more clearly visible.
During periods of high market volatility, it can be worthwhile to own SPX options—those are the green bars above. Otherwise, equity index options tend to be quite overpriced—that’s all the grey—and that is the reason so many traders gravitate toward options- and volatility-selling strategies.
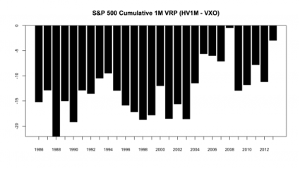
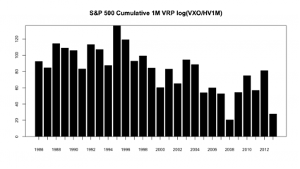
Finally, let’s look at the risk premium values summed by year:
1. At first glance, it looks like the volatility risk premium has been getting smaller over time, but that’s partially an artifact of the estimate. The advantage of looking at the difference between historical and implied vol is that it is an intuitive measure: traders know what it means to sell premium at 18% implied and watch the underlying exhibit 14% realized vol. A log ratio isn’t so meaningful. But the absolute difference between implied and realized increases with the level of volatility, so a log ratio seems a better estimate:
And in that case we find that the returns to being short volatility since 2009 have been similar to those seen in 2000-2007.
2. It’s also worth thinking about how much the value of equity index options in a given year is determined by the position of the market in an economic cycle. In a long, stable period of growth we would expect to see premium values be more negative than in a period marked by frequent, if small, shocks and panics like we have had since 2009.
3. It might be true that the success of volatility products like VIX futures and options and the various ETPs has had some effect on the pricing of SPX options. For instance, if investors who used to buy protection in the form of SPX puts turn to VIX calls instead, will that change affect index-level estimates of SPX implied volatility like VIX and VXO? If we hold the total demand for downside protection constant, will demand that is satisfied in volatility products also be observed as a decline in equity index option vols and activity? There’s been a fair amount of speculation about this in recent years, but I’m not going to add to it here as it seems like an empirical question.
*VXO tracks the implied volatility of near the money strikes for S&P 100 Index (OEX), but it is a good proxy for at the money SPX implied volatility. Since 2009, the mean difference between VIX and VXO was less than 0.7. We’ve looked at VIX and at ATM SPX implied volatility on some other occasions, but I’m using VXO here because a few more years of historical data are available (including 1987) than for VIX and because it does not include the effects of out of the money implied volatility skew.
By Jared Woodard of CondorOptions.com

