Corey Rosenbloom of AfraidToTrade.com takes a technical look at the Dow and S&P 500, highlights several key levels to watch, and shares where he currently stands and where he’ll continue his trade planning based on what he thinks may happen next.
Both the Dow Jones and S&P 500 have bounced between daily moving averages in a key short-term range level.
Soon, both markets will break free from this range.
What’s the range, where are the breakout levels, and what may happen next?
Let’s start with the S&P 500 (SPX) key levels:
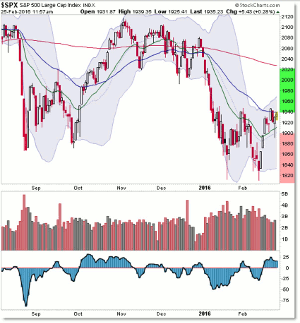
For the S&P 500, our key range levels include 1,900 to 1,940.
We had a slight bear trap reversal Wednesday on a blip beneath 1,900 that was bought/supported by buyers early in the session.
The result—and expectation—was that price travels higher away from 1,900 toward 1,940 again.
That’s where we are Thursday morning and where we’ll continue our trade planning.
A bullish breakout and reversal above 1,940 and 1,945 should lead to an extended bullish swing toward 2,000 or 2,020 like the similar pattern from October 2015.
However, a close beneath 1,900 in the future would continue the bearish/downtrend and open a sell-short pathway back toward 1,820.
To see the remaining chart and to read the entire article, click here…
By Corey Rosenbloom, CMT, Trader and Blogger, AfraidToTrade.com


