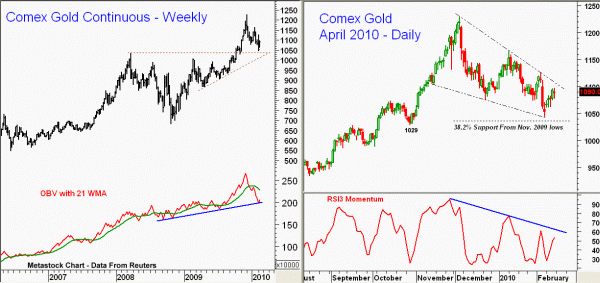
Gold’s decline from the early-December highs has been severe enough to cause many bulls to give up. This is what a correction is supposed to do, and in my view, it is a correction. The weekly chart shows that the March 2008 highs are being tested. The weekly OBV did confirm the highs and is now below its WMA, but at support. The daily triangle is still intact in terms of both price and momentum. Before the correction is complete, one more new correction low (1038-1042) is possible with key support at 1029.
COMMODITIES
Gold: Major Top or Not?
02/15/2010 9:28 am EST•1 min read

Top Pros’ Top Picks (Daily)
Subscribe to MoneyShow’s daily investment newsletter Top Pros' Top Picks and get actionable advice from our top experts, including the hottest stocks to buy and sell, ETFs and funds for short- and long-term capital appreciation, and a wide variety of dividend-paying stocks set to deliver a steady stream of safe, reliable income.

Trading Insights (3x/Week)
Get an edge on the markets with our three-times-a-week trading newsletter, Trading Insights. Receive timely trade ideas covering stocks, options, futures, and more to keep you on the right side of the action. From trading basics to advanced strategies and high-probability set-ups, the insights you need from our all-star lineup of trading pros is delivered straight to your inbox.
Trending Now
Filter By Category
Filter By Keywords
Loading...


