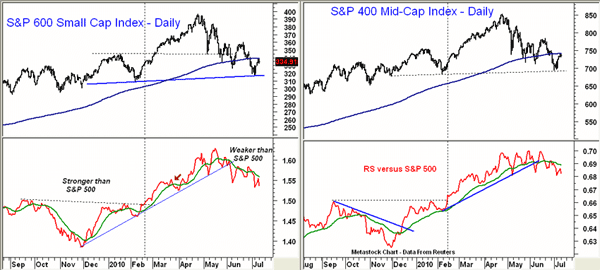
The rally from last week’s lows has been quite impressive as the A/D indicators continue to move higher. The S&P 500 still has strong resistance in the 1090-1100 area and a major resistance level lies at 1130. The S&P 400 and S&P 600, which represent the mid-cap and small-cap stocks, respectively, have underperformed the S&P 500 over the past week. The uptrends in their RS indicators have both been broken and both MAs are now declining. Both averages are now testing their flattening 200-day MAs.
Tom Aspray, professional trader and analyst, serves as video content editor for MoneyShow.com. The views expressed here are his own.


