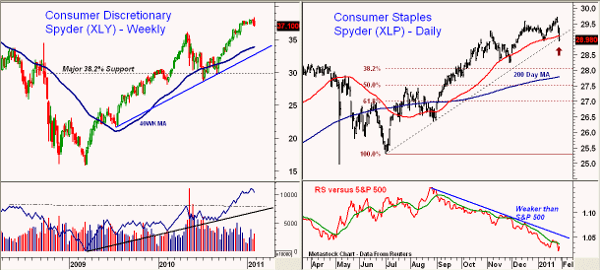
It was a rough session for all stocks on Friday and some sectors in particular were hit very hard. Only two of the major sector Spyder ETFs were able to close the week with gains; the Energy Select SPDR (XLE) was the clear winner, up 1.43% for the week, while the Technology Select SPDR (XLK) was up just 0.43%. XLE is also doing the best so far this year, up over 4%. The Consumer Discretionary Select SPDR (XLY) and Consumer Staples Select SPDR (XLP) were two of the worst, down 1.90% and 1.73%, respectively. The Health Care Select SPDR (XLV) also did poorly, declining 1.7% for the week.
Chart Analysis: The weekly chart of XLY shows a pattern of higher highs and higher lows since the middle of 2009, consistent with a positive major trend.
- The on-balance volume (OBV) has also made higher highs and broken through major resistance in the fall of 2010
- First good support is at $36, which corresponds to the early-2010 highs
- The rising 40-week moving average (MA) and uptrend are now in the $32.80-$34 area
- Major 38.2% retracement support is at $30
- Initial resistance is in the $38-$38.40 area
- The next support is in the $28.50 area with the 38.2% support from the June lows just above $28
- The rising 200-day MA is at $27.80 with the 50% support at $27.50
- The relative performance (RS) line is in a solid downtrend, indicating that this ETF has been weaker than the S&P 500 since last September. It shows no signs yet of turning around
What It Means: The RS analysis of XLY (not shown) shows that it was outperforming the S&P 500 until early December when it turned negative. This combined with the strong selling on Friday suggests that XLY will be lagging over the near term. This is also true for XLP, which despite its 11% rally from the August lows, has been lagging the S&P 500 and looks weaker than XLY.
How to Profit: Clearly these are not two of the best sector ETFs or sectors to be looking at for new stock picking ideas, particularly the consumer staples. The poor earnings of Procter & Gamble (PG) played a large role in this sector’s slide as it makes up 15% of the ETF. I have no recommendation for XLP at this time. For XLY, I would look for a further correction to the $34 area as a potential buying level once the daily technical studies turn positive. The intermediate trend is positive.
Tom Aspray, professional trader and analyst, serves as senior editor for MoneyShow.com. The views expressed here are his own.


