Advance/Decline (A/D) data can be highly useful for measuring the market’s strength and identifying opportunities.
The relentless nature of the recent stock market rally has many market veterans nervous about the short term and possibly the intermediate trend. Of course, it is the intermediate trend that is most important to investors and should also be watched by traders. In addition to my volume analysis, the most important tool that I use to determine the intermediate trend in the stock market is the Advance/Decline (A/D) line. As I discussed in an earlier article, Tradestation.com has recently released A/D data on different market averages. In this article, I will compare the Russell 2000 data with the iShares Russell 2000 Index (IWM) and the S&P 500 A/D data with the Spyder Trust (SPY) to see if these market sectors are as healthy as the big cap indices.
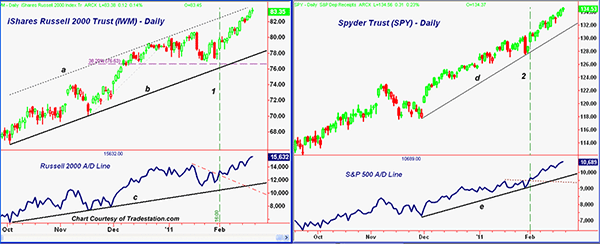
Chart Analysis: The daily chart of IWM shows a well-established trading channel (lines a and b) that goes back to the October lows.
- The close on Friday at $83.35 was not far below the upper channel, line a, which is now at $85. This corresponds to the all-time highs from 2007
- There is initial chart support in the $80 area and the January highs with more important support at $77
- The correction in January held above the short-term 38.2% support level at $76.63
- The Russell 2000 A/D line moved well above the January highs in the past week, confirming the new price highs
- The break through short-term resistance on the A/D line at the start of February (line 1) signaled that the correction was over
- No signs yet of any short-term divergences in the A/D line, which would typically be formed for a meaningful correction
The steady nature of the uptrend in SPY helps to explain the low overall market volatility. SPY, unlike IWM, is still well below the May 2008 highs at $144.
- There is near-term resistance next in the $135.60-$137 area
- Initial support is now at $131.30-$132 and then in the $130 area
- There is more critical support at the January lows in the $127-$127.70 area
- From a historical perspective, the S&P 500 advance/decline line confirmed the April 2010 highs, but unlike the NYSE A/D line, it did not surpass those highs until December. In contrast, the NYSE A/D line was leading prices during the summer and surpassed the April highs in August. (See “Advance/Decline Line Hits New High.”)
- The S&P A/D line shows a solid uptrend from the December lows. It broke out at the start of February (line 2), confirming a resumption of the uptrend
- The breakout level is now short-term support for the A/D line.
What It Means: Having followed the NYSE A/D line since the early 1980’s, I have found it to be a very reliable tool for determining whether the overall stock market trend is up or down. These “new” A/D lines do not yet have long-term data available, but I am very excited about them for current market analysis. Combining this analysis with relative performance analysis should give the ability to better identify the best- and worst-performing market sectors.
How to Profit: This is a tough market if you are trading or trying to invest in a market index, as a 1%-2% correction could come at any time. For those who trade or invest in individual stocks, the mid cap and large cap stocks are leading the market higher, while the small cap stocks are still lagging. The positive intermediate trend suggests that buying stocks that have just completed bases or continuation patterns where the risk can be well controlled should provide the best opportunities at this time.
Tom Aspray, professional trader and analyst, serves as senior editor for MoneyShow.com. The views expressed here are his own.


