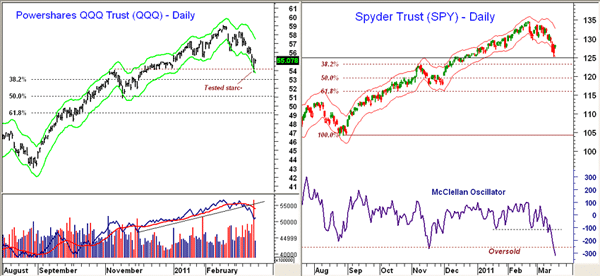
Stocks turned higher today after a second wave of heavy selling on Wednesday took the major averages and related ETFs to the first support levels identified in my Tuesday column, "How Low Can Stocks Go?" Clearly one day does not change a trend, but it does allow me to put together a possible scenario for the next few days.
Chart Analysis: The strongest market index since the summer lows has been the Nasdaq 100, as represented by the Powershares QQQ Trust (QQQQ), but it has given up leadership over the past few weeks. It dropped to a low of $53.77 Wednesday, just below support at $54 that goes back to the early-November lows.
- The more important 38.2% support from the August lows is at $53 and is likely to be reached before the correction is over
- Major support is still at the 50% support level and the rising 200-day moving average (MA), which are at $51.10 and $50.78, respectively
- The current rally is likely to stall where there is initial retracement resistance at $55.80 to $56.40, and there is further resistance in the $57 area
- The daily on-balance volume (OBV) has broken support and is below its weighted moving average (WMA). It could rally back to its WMA before the rebound is over.
The S&P 500 exchange traded fund (SPY) sold off sharply in late trading Wednesday and reached a low of $125.28, just above the support at $125 that went back to the December lows.
- The 38.2% support level from the August lows is at $123.26. This also corresponds to October 2010 highs and should provide strong support
- The more important 50% support level is at $119.61 with the 200-day MA at $118.62
- On a rebound, there is initial resistance now at $128.90 and then stronger at $129.50-$130
- The McClellan Oscillator, a statistical study of money entering and leaving the New York Stock Exchange, closed at -317 on Wednesday, the most oversold reading since May 20, 2010, when it reached -420. It could now rally back to the -150 to -100 area but is unlikely to move back above zero before the rebound runs out of steam
The iShares Russell 2000 Index (IWM) held above Tuesday's lows at $77.57 on Wednesday, which was a positive sign as QQQQ and SPY did make lower lows. There is further support at $77. The 38.2% retracement level and the November 2010 highs are at $74.25 with the 50% support at $71.25. First retracement resistance for the rebound is now at $80-$80.70.
What It Means: In a typical market, one that's not sitting on a knife's edge waiting for more news, a rebound would carry over for another day or two. This requires that the market holds most of its gains into the close. It will also be important that the ratios of advancing to decline stocks in each market stay strong. On the NYSE, advancers currently outnumber decliners four-and-a-half to one. Of course, a worsening situation in Japan could quickly halt the rally.
How to Profit: Despite the heavy selling Wednesday, I would expect those lows to be tested and more likely broken by at least a small margin before a short-term bottom can form. If the market rallies into early next week then drops back to new correction lows, the McClellan Oscillator could complete a bullish, short-term bottom formation.


