
The latest chart analysis confirms that an important low is in place for natural gas, and several great profit plays are now being presented, including an ETF that could triple from current levels.
The purchase of XTO Energy in December 2009 by Exxon Mobil (XOM) for $31 billion raised some eyebrows and made it the largest producer of gas in the US. The recent $1.7 billion acquisitions of Phillips Resources and TWP, Inc. gives Exxon Mobil access to 317,000 acres in the Marcellus Shale.
The timing for Exxon looks pretty good, as the natural gas futures appear to have completed a major bottom. In early May, I noted that the on-balance volume (OBV) on the United States Natural Gas Fund (UNG) had formed a five-month bullish divergence. That fund now has the potential to triple from current levels.
The decision by Germany to close its nuclear plants is likely to be followed by similar action from other European countries. This should be an added positive for natural gas, which is the cleanest nuclear alternative.
Click to Enlarge
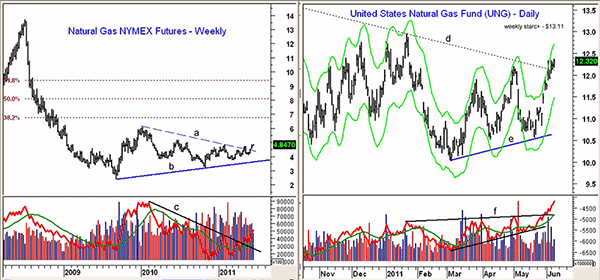
Chart Analysis: Natural gas futures have risen from a low of $4.03 in mid-May to $4.83, a gain of 20%. The gas futures hit a high of $13.69 in June 2008. The weekly chart of the Natural Gas NYMEX futures shows the completion of a triangle formation, lines a and b. The next band of resistance is in the $4.90-$5.20 area.
- The highs from 2010 are at $6.10 with the major 38.2% retracement resistance at $6.77
- The 50% resistance is at $8.21 with the key 61.8% level at $9.38
- The weekly OBV has broken its downtrend and the volume surge in the nearby August contract is quite impressive
- The futures have near-term support in the $4.20-$4.50 area
The United States Natural Gas Fund (UNG) dropped to low of $10.57 on May 19. It briefly tested $10.89 on May 26 when a bearish supply report was released. UNG’s ability to rebound from the intraday lows and close near the highs was a positive sign.
- UNG has just broken its daily downtrend, line d, with next strong chart resistance in the $13 area. The weekly Starc+ band is now at $13.11 with the daily Starc+ band at $12.72
- The minor 23.6% retracement resistance is at $38.21, which is more than three times higher than current levels. The 38.2% resistance is at $55
- The daily OBV has broken out of a bottom formation, having overcome resistance at line f. The weekly OBV (not shown) is also positive
- There is minor support in the $12 area with stronger support in the $11.50-$11.70 area. The daily support, line e, is in the $10.60 area
NEXT: Top Stock Plays in Natural Gas
|pagebreak|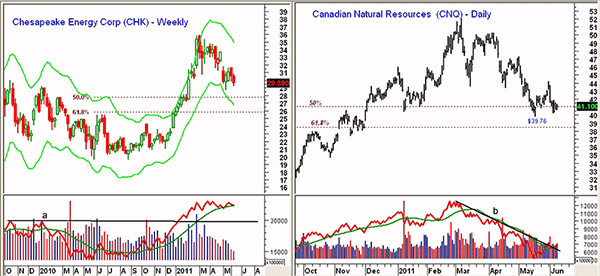
Click to Enlarge
Chesapeake Energy (CHK) is an $18.8 billion natural gas company whose co-founder and CEO, Aubrey K. McClendon, generates lots of controversy. CHK has declined from its March high of $35.95 to a low several weeks ago of $28.75.
- The major 50% retracement support, as calculated from the 2010 lows at $19.68, is at $27.84, while the major 61.8% support is at $25.91
- The weekly Starc- band comes in the middle of these support levels at $26.77
- The weekly OBV is still slightly above its weighted moving average (WMA), as volume has been low on the correction. Major OBV support is at line a. The daily OBV (not shown) is just slightly negative
- There is initial resistance now at $31-$31.60 with more important resistance at $33.20
Canadian Natural Resources Limited (CNQ) was recommended on May 25 (see “Is Natural Gas Bottoming?). CNQ is holding above the lows made several weeks ago at $39.76. The stock peaked in March at $52.04 and has since declined 23.6% from these highs.
- The 61.8% support is at $38.50 with the weekly uptrend (not shown) in the $38.30 area
- The daily downtrend in the OBV has been broken, which is any early sign that the decline may be over
- The weekly OBV (not shown) did confirm the highs and is still holding above its weighted moving average
- There is initial resistance for CNQ at $41.50 and then at $44.00. A move above $47.32 would confirm that a new uptrend is underway
What It Means: The weekly analysis of both the natural gas futures and UNG strongly indicates that an important low is in place. The purest play is in UNG, as natural gas futures, also referred to in the commodity pits as “The Widowmaker,” are best left to professional traders.
Three natural gas stocks should also benefit from higher gas prices, and two of them are currently trading in my original buying zones and still could be bought despite the weak overall market.
How to Profit: For Chesapeake Energy (CHK), go 50% long at $28.62 and 50% long at $27.94 with a stop at $25.74 (risk of approx. 8.2%). On a move above $31.70, raise the stop to $28.26.
As per the May 5 recommendation, buyers should be 50% long United States Natural Gas Fund (UNG) at $10.77 and 50% long at $10.44 and will have raised the stop to $10.47 on the move above $11.90. Sell half that position at $14.22.
For those not already long UNG, I will watch for a setback to make a new buying recommendation. A partial long position was recommended on May 25 at $10.94, and that order was filled on May 26, as the low was $10.83. Raise the stop on that position to $10.47.
Buyers should also be 50% long Devon Energy (DVN) at $80.26, and I would add a 50% long position at $78.46 with a stop at $75.93 (risk of approx. 4.2%). On a move above $85.60, raise the stop to $79.82.
Previous buyers should be 50% long Canadian Natural Resources Limited (CNQ) at $40.62 and 50% long at $39.92 with a stop at $37.84. Those not currently long CNQ could still buy at $40.88 or better with a stop at $37.84 (risk of approx. 7.4%). On a move above $42.60, raise the stop on all CNQ positions to $39.66.


