
Risk is elevated on these four Nasdaq 100 leaders, but all are strong outperformers that could lead the market’s next rally. Look for good entry points in the days and weeks ahead.
Last week’s ugly close sets the stage for the completion of the flag formations that I discussed last week. In very early trading on Monday, the E-mini S&P 500 futures were trading down over 17 points and had broken the support of the flag formation. A close below this support will set the stage for further selling this week.
The technology sector, as represented by the Nasdaq 100 and the PowerShares QQQ Trust (QQQ), is acting much better than the S&P 500 and the Dow Jones Industrial Average. Tech stocks have rebounded further from the August lows and may be able to hold those August lows while the other major averages break to new lows.
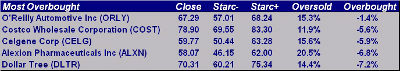
Click to Enlarge
This table shows the five stocks in the Nasdaq 100 that are closest to their weekly Starc+ bands. For example, O’Reilly Automotive Inc. (ORLY) closed at $67.29, which was just 1.4% below the weekly Starc+ band at $68.29. In the oversold column, you can see that ORLY is 15.3% above the Starc- band. Therefore, it would take a 15% drop to take it to that Starc- band.
Though the stocks on this list are currently at high-risk buy levels, they are also performing better that the overall market. Therefore, they are expected to be market leaders on the next rally.
NEXT: See Latest Chart Patterns for ORLY, COST
|pagebreak|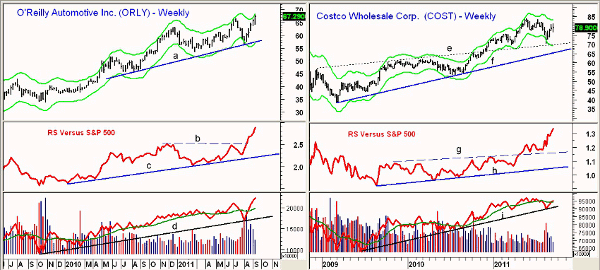
Click to Enlarge
Chart Analysis: O’Reilly Automotive Inc. (ORLY) has a very bullish weekly chart that shows a clear pattern of higher highs and higher lows over the past two years. It made a new all-time high last week and is up almost 20% from its August low of $56.25.
- There is initial support now at $64 with stronger support in the $60-$61.40 area
- The uptrend (line a) and the Starc- band are in the $57area
- The relative performance, or RS analysis, has been in a strong uptrend, line c, since early 2010. It broke through resistance, line b, in the middle of August
- The weekly on-balance volume (OBV) made new highs last week and confirmed the price action. It is well above its weighted moving average (WMA) and support at line d
Costco Wholesale Corp. (COST) peaked in May at $83.59 and the chart shows a fairly normal corrective pattern from the highs. One more drop is possible before it is completed.
- There is next resistance for COST at $81.50-$82 with major resistance at $83.45-$83.95
- Though COST has essentially been correcting for the past four months, its RS line is rising strongly after staging an impressive move through resistance, line g, in April
- The weekly OBV did confirm the recent highs and has just moved back above its weighted moving average. Overall volume on the decline has been lighta
- There is initial support now at $76-$77.50 and then stronger support in the $73-$74 area. The breakout level (line e) was almost tested in August when COST made a low of $70.22
- The longer-term uptrend, line f, is in the $66.50 area
NEXT: Latest Charts for Nasdaq 100 Leaders CELG, ALXN
|pagebreak|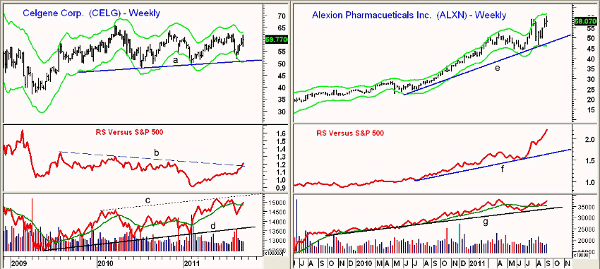
Click to Enlarge
Celgene Corp. (CELG) has been in a broad trading range since the early-2010 highs at $65.79. It came very close to the Starc+ band last week. There is first support now at $55-$56 with further support at $53.50.
- The lower boundary of the trading range on the weekly chart, line a, is in the $50-$50.50 area along with the weekly Starc- band
- The RS has been rising gradually for most of 2011 and has just moved above resistance at line b. This is a positive sign, but a move above the 2010 highs would provide more convincing evidence that CELG is ready to break out of its range
- The OBV shows a much more bullish pattern, as it has formed higher highs, line c, and is acting stronger that prices. It has just moved back above its WMA and is well above long-term support at line d
- There is resistance now at $61.80-$62.50 and a weekly close above $63.50 should be enough to complete the trading range.
Alexion Pharmaceuticals Inc. (ALXN) is a $10 billion biopharmaceutical company that made a new all-time high last week at $60.81. It traded as low as $15.39 in 2009.
- There is first good support now at $55 to $53 with stronger support at $50
- The weekly uptrend, line e, is in the $47.50 area with the August low at $46.56
- Though it is hard to tell from the scaling, the RS broke out of its base formation in August 2010 when ALXN was trading in the $28 area. The RS is currently rising sharply, which is quite bullish
- The weekly OBV has stayed above its weighted moving average since July and is very close to the April highs
- A breakout from the broad trading range has targets n the $70-$72 area
What It Means: The action of these four stocks in a weak market is impressive, and they are likely to be well supported on a further market decline. A decline back to stronger support and the weekly Starc- bands should provide good buying opportunities.
Celgene Corp. (CELG) still needs to prove itself on the upside, but the other three stocks all show very strong relative performance, which suggests they will continue to lead the market on the upside. All are appropriate for the growth portion of your portfolio.
How to Profit: O’Reilly Automotive Inc. (ORLY) it is unlikely to drop back and test the August lows. Go long at $62.68 with a stop at $58.34 (risk of approx. 6.9%).
For Costco Wholesale Corp. (COST), go long at $73.76 with a stop at $69.28 (risk of approx. 6.0%).
Alexion Pharmaceuticals Inc. (ALXN) is a bit more volatile. Go long at $50.68 with a stop at $46.36 (risk of approx. 8.5%).
For Celgene Corp. (CELG), go long at $51.88 with a stop at $48.62 (risk of approx. 6.3%).


