
Bullish option plays are piling up for a pair of emerging market ETFs, and those who believe the case for a year-end rally can look to buy the funds on setbacks in the week ahead as well.
It has clearly been a rough year for emerging markets, and investor sentiment towards the emerging markets has dropped for most of the year. Inflationary pressures caused many countries including India and China to raise rates early in the year, while Brazil has lowered rates twice since August.
Fears surrounding another recession have outweighed inflation concerns in Brazil even though the current inflation rate is 7.3%. China has also been cutting rates, but the markets were encouraged by recent data showing the manufacturing sector in China was improving. The International Monetary Fund (IMF) is projecting a 6.1% growth rate for the emerging markets in 2012, as compared to only 1.9% in the developed world.
A bet on the emerging markets is consistent with my view that the US economy is really stronger than most expect. Option traders appear to agree, as option volume in two key emerging-markets ETFs has surged.
For example, the open interest on the December 42 calls on the iShares MSCI Emerging Markets Index Fund (EEM) has surged to 198,000 contracts with open interest on the December 45 calls at 115,494.
There is also a similar bullish bet on Brazil, as the volume on the January 80 calls for the iShares MSCI Brazil Index Fund (EWZ) surged to 42,500 on Wednesday. With EWZ still 30% below the strike price, this seems like a widely bullish bet, but are there any technical signs that these option traders are right?
Click to Enlarge
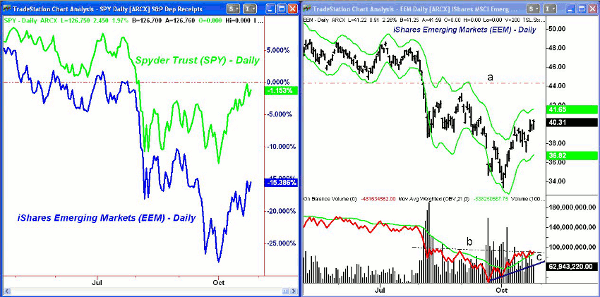
Chart Analysis: The percentage change chart (a unique feature in Tradestation) shows that despite the 16% rally from the October 4 lows, EEM is still down 15.3% for the year.
- The Spyder Trust (SPY) was down 12.7% for the year on October 3 but now is down just over 1%
- The daily chart of EEM shows next resistance in the $41 area with the daily Starc+ band at $41.65
- The 50% Fibonacci retracement resistance is at $41.95
- The more important 61.8% resistance is in the $44 area, line a. This also corresponds to former strong chart support which is now resistance
- The heaviest volume of the past few months occurred in August and the lower volume in October is consistent with a market bottom
- The daily on-balance volume (OBV) formed a positive divergence at the lows, line c, but the weekly OBV (not shown) did not
- A move in the OBV above resistance at line b will complete the bottom formation
- There is minor support now at $39 with stronger support in the $37-$37.50 area
NEXT: Risk-Controlled Set-up in Popular Brazil ETF
|pagebreak|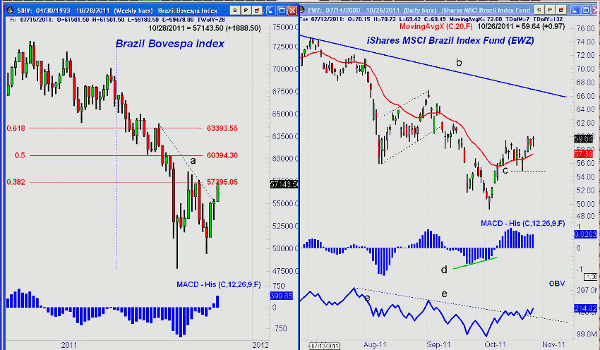
Click to Enlarge
The weekly chart of Brazil’s Bovespa Index shows that the weekly downtrend, line a, has been broken, yet the index is still down over 19% for the year.
- The 38.2% resistance level has been reached with the 50% retracement resistance at 60,394
- The MACD-Histogram turned positive last week and will move further into positive territory this week. The MACD-His had been negative since late last year
- There is initial support at 55,000 with stronger support at 53,000
The iShares MSCI Brazil Index Fund (EWZ) is still below the September high at $61.88 with the 50% retracement resistance at $65.64. EWZ hit a high of $80.23 in April.
- The daily downtrend, line b, is at $66.60 with the 61.8% retracement resistance at $68.32
- The daily MACD-His formed a positive divergence at the lows, line d, before moving above the zero line
- The daily OBV did not form any divergences at the October lows but has moved through its downtrend, line e, and has now turned up sharply
- The weekly indicators (not shown) are still negative
- There is first support now at $57.40 and the rising 20-day exponential moving average (EMA)
- There is stronger support at $55, line c
What It Means: If the economies of the developed nations improve for the rest of 2011 and into early 2012, I expect the emerging economies to do quite well. As noted yesterday, the action in crude oil is consistent with increased demand from emerging markets. Funds are starting to flow back into the emerging markets, but it does seem to be early in this cycle.
Though the emerging market ETFs do not show typical weekly bottom formations, they may have formed relatively rare V-shaped bottoms. Those with no emerging market exposure could add initial positions on a setback in the next week.
How to Profit: For the iShares MSCI Emerging Market Index Fund (EEM), go 50% long at $39.66 and 50% long at $38.54 with a stop at $36.77 (risk of approx. 5.9%). Cancel the order if $41.60 is hit first.
For the iShares MSCI Brazil Index Fund (EWZ), go 50% long at $58.82 and 50% long at $57.04 with a stop at $54.66 (risk of approx. 5.6%). Cancel the order if $64.80 is hit first.


