Bullish chart patterns and favorable relative performance analysis make select Nasdaq stocks worth buying on any pullbacks, which could take place in the coming weeks.
As noted on Friday, the daily analysis of the PowerShares QQQ Trust (QQQ) shows that it has now started to outperform the S&P 500.
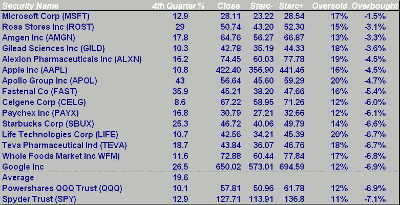
In my weekly Starc band analysis of the Nasdaq 100 stocks, I wanted to concentrate not only on those that were the closest to their weekly Starc+ or Starc- bands, but also how these stocks had performed against the major averages since October.
Microsoft (MSFT) is the most overbought, having closed last week at $28.10, just 1.5% below its weekly Starc+ band at $28.54. Of the 15 stocks on the list, all were less than 7% below their Starc+ bands. The average performance of these stocks (since October, from FT.com) was 19.6%.
These stocks outperformed QQQ by 9.5% and the Spyder Trust (SPY) by 6.7%, which is quite impressive for a three-month period. The four companies I will focus on have quite interesting chart patterns that suggest they are likely to continue to outperform the averages.
NEXT: Nasdaq Leaders to Watch in the Coming Weeks
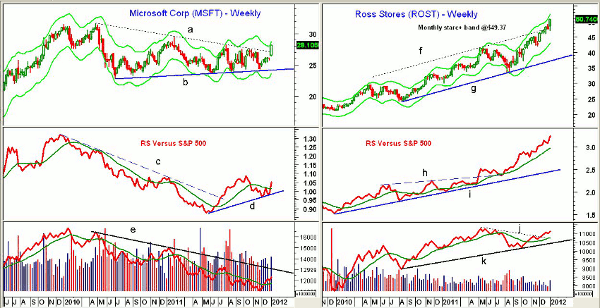
|pagebreak|Chart Analysis: Microsoft (MSFT) has just completed a flag formation, lines a and b, dating back to the beginning of 2010. The next chart resistance is at the 2011 highs of $29.46.
- The flag formation has Fibonacci targets at $34-$35 with the 2007 highs at $37.50
- Relative performance, or RS analysis, broke its downtrend, line c, in the middle of July
- The RS line has just moved back above its weighted moving average (WMA) and shows a positive uptrend, line d
- The weekly on-balance volume (OBV) has not yet confirmed the breakout, as it is still below its downtrend, line e. The daily OBV (not shown) looks strong
- There is initial support now in the $26.80-$27.20 area
Ross Stores (ROST) operates off-price apparel and home furnishing stores throughout the US. It has been on a tear over the past few months, rising from a low of $41.99 to $50.74 last Friday.
- It is now trading above its monthly Starc+ band, which is at $49.37. Though this does not mean that ROST will correct immediately, it is clearly entering a high- risk area
- The RS line has been in a strong uptrend since early 2010 and broke through resistance, line h, in May
- The RS line is well above its strongly rising weighted moving average
- Weekly OBV has not yet confirmed the price highs but is rising strongly. The short-term downtrend (line j) was broken five weeks ago, signaling the recent rally
- Long-term support in the OBV is at line k, and the daily OBV is very close to making new highs
- There is first support in the $49 area with more important support now at $46-$47
NEXT: More Strong Performers to Buy on Pullbacks
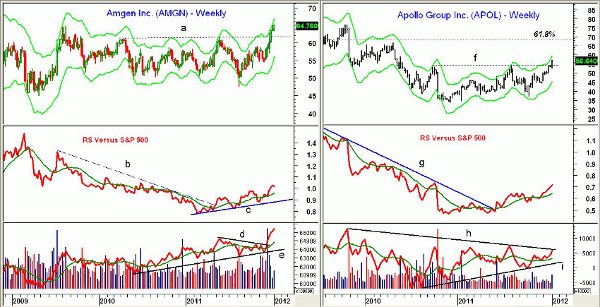
|pagebreak|Amgen Inc. (AMGN) staged an impressive breakout two weeks ago, overcoming resistance at $61.80, line a. The major 61.8% Fibonacci retracement resistance is at $72 with the 2005 highs at $86.92.
- Relative performance broke through its downtrend, line b, in May
- The RS line is now in a clear uptrend, line c, with higher highs and higher lows
- Weekly OBV has confirmed the price action, surging through resistance (line d) in early 2010
- There is good support now in the $61-$62.20 area with further support at $58
Apollo Group Inc. (APOL) is a $7.1 billion education and training services company. It closed strongly last week, as the resistance going back to September 2010 (line f) was overcome.
- The 50% Fibonacci retracement resistance from the 2009 highs at $90 is at $61.74 with the 61.8% resistance at $68.34
- The two-and-a-half-year downtrend in the RS line was broken in May and has moved further above its rising weighted moving average in the past few weeks
- Volume increased last week, and the weekly OBV is above its weighted moving average but still below its long-term downtrend, line h
- The uptrend in the weekly OBV, line i, suggests accumulation
- There is first support at $54.40 and then at $51.80-$52.20
What It Means: Even though the Nasdaq 100 is still well below the 2011 highs at 2438, last week’s positive action versus the S&P 500 could be forecasting a good earnings season for the stocks in this index.
Comparing the raw performance data of stocks versus a major average is another way to identify the market-leading stocks.
Three of the four stocks mentioned today have just completed bullish weekly chart formations. Therefore, even though they are currently close to their Starc+ bands, new longs would be favored on a pullback, which should come before the end of January. Option traders could also look to establish bullish option position on such a pullback.
How to Profit: Those who are currently long Ross Stores (ROST) might consider hedging part of their position on a move to the $51.50-$52.50 area to lock in some profits.
For Amgen Inc. (AMGN), go 50% long at $62.04 and 50% long at $61.12 with a stop at $58.84 (risk of 7.7%).
For Apollo Group Inc. (APOL), go 50% long at $62.04 and 50% long at $61.12 with a stop at $58.84 (risk of 7.7%).
Editor's Note: Corrected Price Levels: For Apollo Group Inc. (APOL), go 50% long at $52.04 and 50% long at $51.12 with a stop at $48.84 (risk of 7.7%).
From my September 19 recommendation, buyers should be long Microsoft (MSFT) at $25.78 with a stop at $23.42. In December, I again recommended buying at $25.78. On these positions, use a stop at $25.32. I will be looking for another entry point on the first pullback.


