Fundamentally inspired picks from a market expert are put to the test by using technical analysis to validate the bullish outlook and highlight important price levels.
Each year, Barron’s publishes a roundtable discussion with market experts and shares their outlook and recommendations for the coming year. As I’ve mentioned before, I started analyzing the stock market from a technical standpoint over 30 years ago using manually entered data from Barron’s.
I’ve had the opportunity to meet and interview Ed Finn, the editor and president of Barron’s, who always has a very interesting and timely perspective on the markets. In fact, in an interview from early last year, he was recommending buying gold, which as we now know was definitely a good idea!
I always find the outlook from the roundtable guests to be quite interesting, especially since the majority use fundamental analysis rather than technical analysis. Though I am a diehard technical analyst, I have always believed that an astute combination of both fundamentals and technicals is best.
Therefore, I wanted to take a technical look at this year’s choices, as recommended by one of the pros, Fred Hickey, editor of the High-Tech Strategist newsletter.
In searching for information on the long-term performance, I found one source that seemed reliable, which reported that Fred had the best return for 2011 at 9.2%. During the period from 2005 through 2011, Fred’s recommendations had an annual return of 11.2%, which put him in fourth place.
Fred has five picks for the year ahead, so let’s take a look at the charts for four of those.
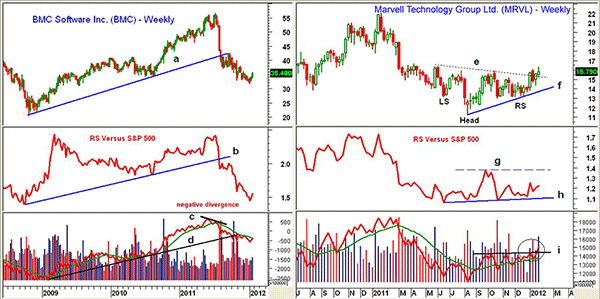
Chart Analysis: BMC Software Inc. (BMC) is a member the Nasdaq 100 and is an application software company with a market cap of $6.04 billion. BMC hit a high of $56.55 in July 2011 and a low of $31.62 in early 2012. It has rallied over 12% in the past three weeks.
- There is next strong resistance in the $37-$38 area with more important support at $40
- The weekly chart shows that the long-term uptrend, line a, was broken in early-August 2011
- The major 61.8% Fibonacci retracement support at $34.19 was violated in late October, which was a negative sign
- The relative performance, or RS analysis, violated support, line b, at the end of July. It has turned up but shows no signs yet of having completed a bottom
- The on-balance volume (OBV) formed a negative divergence, line c, in early July that was confirmed before the end of the month
- The OBV broke its long-term support (line d) in early October and is still below its weighted moving average (WMA)
- There is first support now at $32.50-$34
Another of the stock recommendations is Marvell Technology Group (MRVL). It is a $9.2 billion semiconductor designer that was hit hard by the flooding in Thailand. The stock bottomed in August 2011 at $11.23, and with last week’s close at $15 23, is up 35.6% from the lows.
- The weekly chart shows that MRVL closed above the neckline (line d) during the first week in January. This completed the reverse head-and-shoulders (H&S) bottom formation
- There is resistance at the July high of $16.36 with a price target from the reverse H&S bottom formation at $20.50
- MRVL made a high in early 2011 at $22.01 and had lost almost half its value by the August lows
- The RS analysis is trying to bottom as it has not made new lows since June 2011, line h. It is trying to turn higher but needs to move through resistance at line g to signal that MRVL is becoming a market leader
- The on-balance volume has been forming higher lows since August and has just broken through resistance at line i
- Minor support at $15 20 was tested on Monday with much stronger support in the $14-$14.40 area
NEXT: 2 More Picks Put to the Technical Test
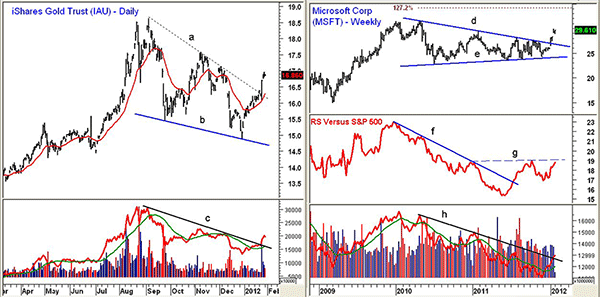
|pagebreak|The iShares Gold Trust (IAU) is another one of Fred’s favorites. It completed its flag formation, lines a and b, last week.
- The 127.2% Fibonacci price projection target is at $19.65
- OBV has broken its downtrend, line c, as volume was strong on last week’s breakout. The OBV is above its now-rising weighted moving average (WMA)
- There is first support in the $16.40 area with additional support in the $15.80- $16 level. IAU made a low of $14.87 in late 2011
Microsoft Corp. (MSFT) is a selection for the second year in a row, according to Barron’s. This pick was down 9.2% in 2011. The weekly chart shows that MSFT has broken out of a major flag or continuation pattern, lines d and e.
- For the past two years, MSFT has been consolidating after its sharp rally in early 2009. There is next resistance at the April 2011 high of $31.58
- The 127.2% Fibonacci projection target is at $33.98. The RS analysis broke its downtrend (line f) last July, and a move through resistance at line g will confirm a major bottom
- OBV has finally broken its downtrend, line h, and is still below the early-2010 highs. The pattern is improving, as volume on the recent breakout has been quite good
- For the intermediate term, a continued expansion of volume on the upside would confirm a major new uptrend for MSFT
- MSFT is overextended on a short-term basis, as it is up 21.8% from the late-November lows
- Initial support now stands at $28-$28.50 with much stronger support and the breakout level at $26.50-$27
What It Means: Fred Hickey also liked the Market Vectors Gold Miners ETF (GDX), and while a few of the gold miners look good, I am not convinced the group as a whole has bottomed.
I would recommend new positions at lower levels in both Marvell Technology Group (MRVL) and the iShares Gold Trust (IAU). I have previously recommended Microsoft Corp. (MSFT) and my buy levels have since been hit.
How to Profit: For Marvell Technology Group (MRVL), go 50% long at $15.34 and 50% long at $14.92 with a stop at $14.08 (risk of approx. 6.9%). Sell half the position at $19.48 or better and raise the stop on the remaining position to $17.44.
For the iShares Gold Trust (IAU), go 50% long at $16.28 and 50% long at $15.82 with a stop at $14.68 (risk of approx. 8.5%). On a move above $17.50, raise the stop to $15.44.
From my previous recommendation, buyers should be long Microsoft (MSFT) at $25.78 with a stop at $26.28. Sell half that position at $31.44.


