Close proximity to technically overbought levels means that these fast-gaining Nasdaq 100 stocks carry high risk at current levels, and shareholders should now lock in hard-earned profits.
As Apple Inc. (AAPL) surges above the $500 level and Wall Street analysts bump their price targets for the S&P to 1400 or 1450, it continues to indicate a market where risk is increasing.
This is opposite of last fall, when the major firms were lowering their forecasts for both the S&P 500 and US GDP at a rapid rate. This was pointed out in the September 23 Week Ahead column, “Is the Majority Wrong?”
Though I can eventually see the S&P 500 reaching 1400 or 1450 sometime in 2012, I don’t expect it in the near future. In looking for stocks to buy, there are currently so many that seem to be quite overextended, and I am not finding many opportunities at present levels.
The Nasdaq 100 has been leading the market higher, as the PowerShares QQQ Trust (QQQ) is up 12.9% so far in 2012. Even though QQQ is still 8%-9% below its next major Fibonacci price target, it is important to take note of the overbought status of the individual stocks that make up the Nasdaq 100.
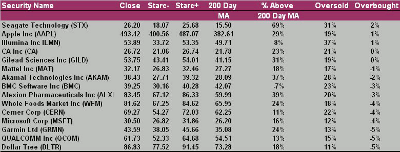
The table above lists Nasdaq 100 stocks that are closest to their weekly Starc+ bands. As I have noted in the past, when a stock is close to its weekly Starc+ band, it is a high-risk time to buy (see “Buy, Sell, or Wait: A Way to Decide”).
The most overbought stock is Seagate Technology (STX), which is currently 2% above its weekly Starc+ band. In fact, the five most overbought stocks on the list are either at or above their weekly Starc+ bands.
Other stocks listed are also very close to their weekly Starc+ bands. For example, Akamai Technologies Inc. (AKAM) is listed at -2%, which means it is just 2% below its weekly Starc+ band.
We can also see the percentage by which each stock is above or below its 200-day moving average (MA). Seagate Technology (STX), which was featured last week in “3 Stocks You Shouldn’t Buy Now,” is 69% above its 200-day MA, which currently sits at $15.50. This is consistent with a very overextended condition, and I continue to suggest selling, not buying, when a stock is this overextended.
NEXT: Steep Uptrend Seen in Nasdaq 100 ETF
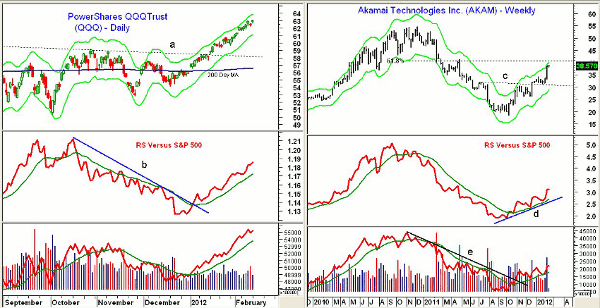
|pagebreak|Chart Analysis: The PowerShares QQQ Trust (QQQ) shows a rather steep uptrend since the start of the year, but it is still well below its weekly Starc+ band at $64.86. The daily Starc+ band is closer at $63.88.
- The relative performance, or RS analysis, looks strong, as it broke its downtrend (line b) and moved above its weighted moving average (WMA) early in 2012
- The daily on-balance volume (OBV) continues to confirm each new price high. It is well above its rising weighted moving average and shows no signs yet of a top
- Minor support now stands at last Friday’s low of $62.25 with stronger support at $60-$60.80
Akamai Technologies Inc. (AKAM) was very strong last week, closing just 2% below its weekly Starc+ band. The major 61.8% Fibonacci retracement resistance from the 2010 high is at $40.70.
- The weekly RS analysis shows a nice bottoming formation and is in a solid uptrend, line d
- The weekly OBV overcame its downtrend, line e, in early February and is well above its rising weighted moving average
- There is now first good support at $35.50-$36.50 and then at $34
- More important weekly chart support, line c, is in the $30.50 area
NEXT: Another Fast Mover That Looks Ripe for a Correction
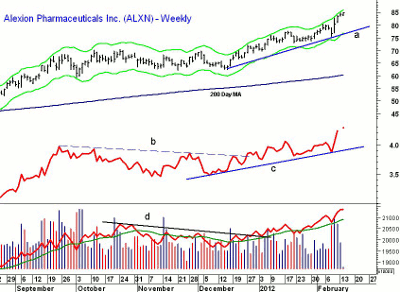
|pagebreak|Alexion Pharamceuticals Inc. (ALXN) is also trading very close to its weekly Starc+ band and is up 12.5% from the early-February lows at $75.04 (line a). The stock is 39% above the strongly rising 200-day MA, which sits at $59.99.
- The RS line just made new highs last week, and from an intermediate-term standpoint, it looks very strong
- The RS line moved through resistance (line b) early in 2012, signaling that ALXN was starting to outperform the S&P 500
- Weekly OBV also made new highs last week, overcoming key resistance, line d, in December
- There is initial support now at $79-$80 with much stronger support in the $74-$76 area
What It Means: Though the Starc bands and moving average analysis clearly identifies that these 15 Nasdaq 100 stocks are overbought, they still could gain another 2%-5% before they start to correct.
The longer it takes for the market to correct, the more violent the correction may be, and as a result, I would recommend taking some partial profits in the two tech-heavy ETFs that I have previously recommended, QQQ and the Select Sector SPDR - Technology (XLK).
How to Profit: For Akamai Technologies Inc. (AKAM), go 50% long at $32.78 and 50% long at $30.66 with a stop at $28.86 (risk of approx 9.8%).
For Alexion Pharamceuticals Inc. (ALXN), go 50% long at $75.88 and 50% long at $74.16 with a stop at $69.56 (risk of approx 7.2%).
Previous buyers should be long the PowerShares QQQ Trust (QQQ) from $56.34. Sell half the position now and raise the stop on the remaining position to $58.12.
For the Select Sector SPDR - Technology (XLK), buyers were 50% long at $23.66, 50% long at $23.12, and sold half the position last week at $28.06. Use a stop on the remaining position at $26.26.
I will be giving a free workshop at the New York Traders Expo on RS analysis. Those interested in attending can sign up here.


