Short interest data shows a lot of investors betting against these shares, but with the technical indicators pointing higher, the short crowd may soon get flattened.
The monthly short interest data has long been watched by some analysts as it provides data on stocks that have the largest short positions. It can often alert you to some interesting opportunities, but keep in mind that short sellers aren’t always right, and that many rely on fundamental and not technical analysis.
Of course if a trader is short a stock and the price rises up, then the trader is losing money and will have a higher margin requirement. In analyzing short interest data one can often look at the short interest ratio. It is calculated by dividing the number of shares sold short by the average daily volume and tells one the number of “average volume” days it would take to cover the short position.
These three stocks have a relatively high short interest and more important have weekly technical patterns that suggest they will move higher, not lower.
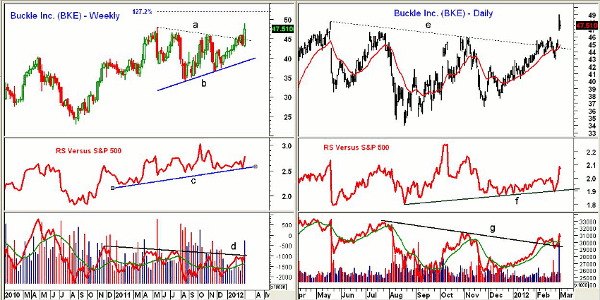
Chart Analysis: Buckle Inc. (BKE) is a $2.3 billion retail seller of men and women’s casual apparel and shoes throughout the US. BKE had a slight monthly increase in the number of shares short and has a short ratio of 23. The weekly chart shows the completion of a ten-month flag formation, lines a and b.
- The 127.2% Fibonacci retracement target is at $52 with the monthly Starc+ band at $54.40
- The measured targets from the flag formation are in the $58-$60 area
- The weekly relative performance, or RS analysis, has turned up sharply and shows a pattern of higher lows, line c
- Weekly volume was heavy last week and the on-balance volume (OBV) has moved above resistance at line d
- Initial weekly support is at $42.90, which was last week’s low
The daily chart shows the higher gap opening last Thursday and the convincing break above the resistance at line e. There is gap support now at $45.64-$46.76 with the mid-February highs at $45.97.
- The daily RS line has jumped sharply and has moved above three-month resistance
- The daily chart shows that the volume was strong on the gap higher last week
- The daily OBV has broken its downtrend, line g, but is still below the November highs
NEXT: 2 More Dangerous Short Plays to Avoid
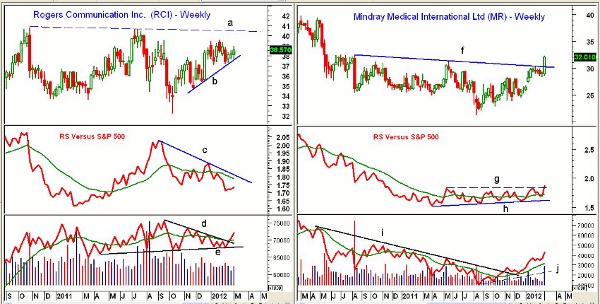
|pagebreak|Rogers Communications Inc. (RCI) is a $20.2 billion Canadian media and communications company. The number of shares short increased by 600,000 last month, and RCI now has a whopping short ratio of 56.
- The weekly chart shows that the uptrend, line b, was again tested last week before RCI closed higher
- There is next resistance at $39.58 with major resistance at $40.82, line a. A close above this level will signal a rally to the 2008 highs at $46.40
- Weekly relative performance is still in a downtrend (line c) and below its declining weighted moving average (WMA)
- Weekly OBV looks much stronger, as it has broken its downtrend, line d, and moved above its weighted moving average
- The OBV shows strong support at line e
Mindray Medical International Ltd. (MR) is a $3.7 billion Chinese medical equipment and supply company. The number of shares sold short rose by 800,000 last month, and MR now has a short ratio of 25.
- The weekly chart shows an impressive close above resistance at line f. Next major resistance at $39.39 to $40.35
- The relative performance appears to have completed its bottom formation as it has moved through its resistance (line g) after testing its WMA
- The weekly OBV looks even stronger as it broke its downtrend, line I, in October and has not surged to the upside
- The daily volume analysis (not shown) reflects very heavy volume last week
- Initial support now at $31 with stronger at $29.80 to $30.30.
What It Means: Over the years, I have often looked for stocks that have a high short-interest ratio as well as bullish volume and chart patterns. The high short interest in many cases has accentuated the price move.
Since I continue to think the overall market is vulnerable at current levels, I would look to buy these stocks close to good support where tight stops can be used.
How to Profit: For Buckle Inc. (BKE), go 50% long at $46.22 and 50% long at $45.48 with a stop at $42.72 (risk of approx. 6.7%). Sell half the position at $51.52 or better and raise the stop on the remaining position to $46.80.
For Rogers Communications Inc. (RCI), go 50% long at $38.34 and 50% long at $37.80 with a stop at $36.88 (risk of approx. 3.1%). On a move above $40.68, raise the stop to $38.44.
For Mindray Medical International Ltd. (MR), go 50% long at $31.14 and 50% long at $30.26 with a stop at $28.08 (risk of approx. 8.6%). On a move above $32.80, raise the stop to $29.44.


