
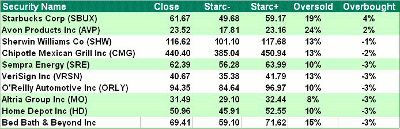
The market’s correction and these stocks’ close proximity to technically overbought levels could cause them to fall 5% in short order, thus presenting favorable new entry points.
Just two weeks ago, the widely watched Spyder Trust (SPY) was just 3.9% below its weekly Starc+ band while the Powershares QQQ Trust (QQQ) was even more overbought, closing March just 2.5% below its weekly Starc+ band.
After the market correction over the past two weeks, QQQ is now 6.8% below its weekly Starc+ band and SPY is 7.4% below. Both are still not oversold, as they remain more than 4% above the weekly Starc- bands.
For more on trading with Starc bands, see this Trading Lesson.
As discussed on Friday, the deterioration in the market internals makes the market vulnerable to a further decline. By analyzing weekly Starc bands, it becomes easier to identify those stocks that may be vulnerable to declines, and also those that could become market leaders.
Click to Enlarge
It is probably no surprise to see that Starbucks Corp (SBUX) and Avon Products Inc (AVP) both closed last week above their weekly Starc+ bands. AVP surged on the initial buyout offer, and many expect a new, higher bid to come out this week.
It is important to note that even if a stock is above its weekly Starc+ band, and therefore, in a high-risk buying area, that stock can still move higher. For example, SBUX closed just 0.1% below its weekly Starc+ band three weeks ago, but it has still gained another 10%.
The combination of Starc band and relative performance, or RS analysis, can be used to spot market leaders that would be good buys once lower-risk entry points were presented. Let’s now look at three market leaders and one stock that has broken through major resistance in the past quarter.
NEXT: The Most Overbought S&P 500 Stocks
|pagebreak|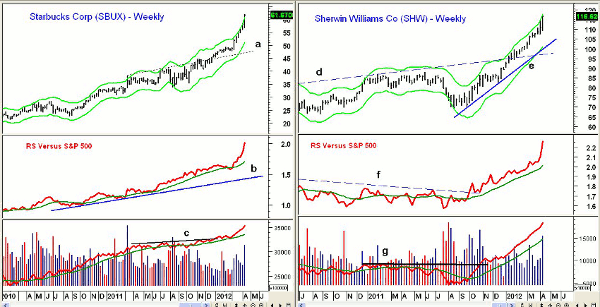
Click to Enlarge
Chart Analysis: Starbucks Corp (SBUX) is up over 20% in the past six weeks after trading in a narrow range throughout most of February. From the weekly chart, the breakout in early January (line a) appears to have been significant.
- SBUX is currently trading 10% above its monthly Starc+ band
- Relative performance, or RS analysis, has been in a powerful uptrend (line b) for the past two years, as it has continued to make new highs
- The RS line dropped below its weighted moving average (WMA) in February before surging to the upside
- Weekly on-balance volume (OBV) also broke through resistance, line c, early in 2012
- OBV jumped sharply last week, and volume was the heaviest since last summer
- There is first good weekly support in the $53.50-$56 area with more important support at $50
Sherwin Williams Co (SHW) broke through almost two-year resistance, line d, in the middle of January. SHW closed just over one dollar below its weekly Starc+ band, and like SBUX, it is trading above its monthly Starc+ band.
- Given the three-month gain of more than 19%, the steep uptrend in the RS line is not surprising
- The RS line completed it bottom formation in early-October 2011, overcoming the resistance at line e when SHW closed at $74.32
- Weekly OBV moved above its weighted moving average in October but did not break through major resistance, line g, until early November
- Last week, volume in SHW was the heaviest in five months
- There is now first weekly chart support in the $107-$108.50 area
NEXT: Chipotle Mexican Grill (CMG) and a Potential New Market Leader
|pagebreak|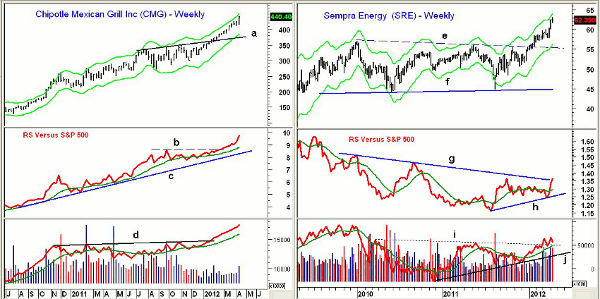
Click to Enlarge
Chipotle Mexican Grill (CMG), like the other four stocks mentioned, was on the new high list last week and up almost 12% in March. The latest surge started after CMG closed above resistance, line a, in late January.
- The breakout in prices was confirmed by the RS analysis in late February when the resistance at line b was surpassed
- Relative performance has been in a long-term uptrend since 2010, line c
- OBV has been in a strong uptrend all year and overcame resistance, line d, in early 2012
- Daily RS and OBV analysis (not shown) are both positive and continue to confirm the price action
- CMG now has first good support in the $410-$415 area.
Sempra Energy (SRE) broke out of a long-term trading range, lines e and f, in January. The initial upside target from the breakout is in the $65 area, which has not yet been met. The two-year trading range likely has longer-term significance.
- RS analysis has just broken its downtrend, line g, which likely completes the bottom formation
- This suggests that SRE’s recent strength could be just the start of a major new rally
- Weekly OBV moved through resistance (line i) in March and shows a longer-term uptrend, line j
- There is first good weekly support for SRE in the $59-$60.30 area with monthly support in the $57-$57.70 area
What It Means: If the current correction is just a pullback in the intermediate-term uptrend, then these four stocks should be well supported. The strong relative performance analysis suggests that they will continue to be market leaders, and Sempra Energy (SRE) may be an emerging leader.
How to Profit: Though these four S&P 500 stocks are overbought, the weekly analysis shows no signs yet of an intermediate-term top. Still, if the S&P 500 breaks below last week’s low at 1357, they could easily correct 4%-6% without altering the intermediate-term trend.
Those currently long any of these stocks should develop a strategy now while prices are still moving higher, and taking partial profits is never a bad idea. I will be watching all of these stocks for good risk/reward entry points in the coming weeks.


