This regular scan suggests that lightening up on Coca-Cola (KO) is wise with the stock near technically overbought levels, but also uncovers two promising buys on future pullbacks.
It was a close call in April, but the Dow Industrials did manage to close 1.59 points higher for the month. Much of the market’s focus late in the month was on Apple Inc. (AAPL) after the company blew away earnings forecasts.
It is not surprising from this performance that none of the stocks in the Dow Industrials closed the month above their monthly Starc+ bands. My monthly scan identifies stocks that are closest to either their upper Starc band (Starc+) or lower Starc band (Starc-).
Regular readers know that the proximity of a stock’s monthly closing price to its Starc bands is one reliable way to identify overbought and oversold stocks. (For more on trading with Starc bands, please read “Buy, Sell, or Wait: A Way to Decide.”)
The top stock on the list is Home Depot (HD), which I have been trying to buy since the start of January, though it has not yet provided enough of a setback. The stock is up 23.2% so far in 2012 but is still 3% below its monthly Starc+ band. Third on the list was AT&T (T), which gained 5.4% in April and also yields a healthy 5.35%.
These scans have resulted in quite a few past recommendations, and monthly analysis has helped me to identify several market-leading sectors.
For those stocks in the top ten that I am currently long, I have included the price and date when those longs were established, as well as the current stop levels I recommend. One of the stock positions was stopped out, but I would recommend buying again, while another future market leader should also be bought on a pullback.
NEXT: The Dow's Most Overbought Stocks
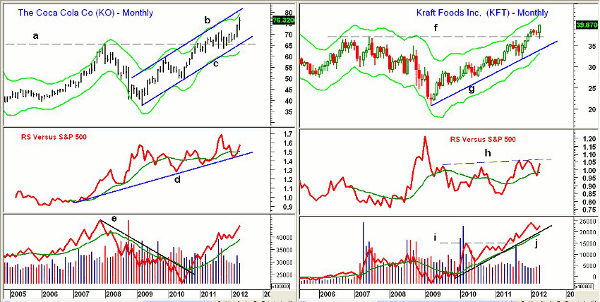
|pagebreak|Chart Analysis: Despite the Dow’s meager gains, Coca Cola Co. (KO) had a good month, as it was up over 3% following a 6% gain in March. The monthly chart shows that KO had been testing long-term support, line a, before is recent surge.
- KO is just 4% below its monthly Starc+ band at $79.27 with the upper boundary of its trading channel at $81.70
- Relative performance, or RS analysis, is in a solid uptrend, line d, and is back above its weighted moving average (WMA)
- Monthly on-balance volume (OBV) broke its downtrend, line e, in 2010 and continues to act very strong, surging last month
- Weekly studies (not shown) are positive but the weekly Starc+ band was tested last week
- There is first weekly support in the $74.50-$75.30 area
Kraft Foods Inc. (KFT) dropped below the initial monthly support at $37.25 in April when it reached $36.60 before closing near the month’s highs. KFT was up 4.9% in April but is still 7% below the monthly Starc band at $42.61.
- There is resistance for KFT from 2002 in the $41.30-$43.95 area
- RS analysis is positive and has turned up sharply from its weighted moving average
- A move through RS resistance at line h would be a strong signal that KFT should continue to outperform the S&P 500
- Monthly OBV broke through resistance at line i in 2011
- OBV is in a solid uptrend after turning up last month. It is above its rising weighted moving average and the uptrend, line j
- There is initial support now at $38.40-$38.30 and then at $37.50
NEXT: Look to Re-Buy a Stock That Got Away
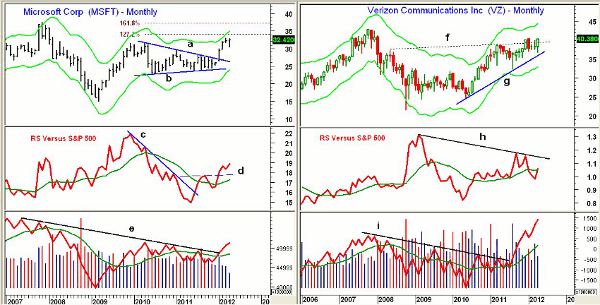
|pagebreak|Microsoft Corp. (MSFT) broke out of its flag formation, lines a and b, in January and is up over 23% so far in 2012. The 127.2% Fibonacci retracement target is just above $34.
- The monthly Starc+ band is at $35.10 and MSFT had a high in 2007 of $37.50
- Monthly RS line looks strong, as it broke its downtrend, line c, in June 2011 and completed the bottom formation in late 2011 when resistance (line d) was overcome
- Monthly OBV broke through a five-year downtrend in early 2012, line e, and is above its rising weighted moving average
- Weekly OBV (not shown) is also positive and above its weighted moving average
- There is first good support in the $30.50-$31.50 area
Verizon Communications Inc. (VZ) closed April above monthly resistance at $39.50, line f. The high for VZ in 2007 was $43.02 with the monthly Starc+ band at $44.47.
- VZ had a high in 1999 of $62.30, so the major 61.8% Fibonacci retracement resistance is at $46.80
- The monthly RS line has moved back above its weighted moving average and has major resistance at the downtrend, line h
- Monthly OBV rose sharply in the middle of 2011 and broke through its downtrend, line i
- The OBV is still rising very sharply and has moved well above the 2007 highs
- Despite last week’s bounce, the weekly OBV (not shown) is still below its weighted moving average
- There is initial support at $39.50 with stronger support at $38-$38.50
What It Means: There are many conclusions that can be drawn from this month’s regular Starc band analysis of the Dow Industrials. First, the monthly analysis of Coca-Cola Co. (KO) suggests that it is time to reduce the size of the position, as it is one of the largest in the “Charts in Play” portfolio.
The monthly analysis also points out that I probably used a too tight a stop on my previously recommended position in Kraft Foods Inc. (KFT). The long position from $34.64 was stopped out on April 10 at $37.14, and the month’s low was $36.60. It closed the month at $39.87.
I would look to again buy Kraft Foods Inc. (KFT), which yields 2.9%, and Verizon Communications (VZ), which offers a 5% yield, on a decent pullback.
How to Profit: For Kraft Foods Inc. (KFT), go 50% long at $39.92 and 50% long at $38.46 with a stop at $36.28 (risk of approx 7.4%).
For Verizon Communications (VZ), go 50% long at $39.56 and 50% long at $38.66 with a stop at $36.44 (risk of approx 6.7%).
For Coca Cola Co. (KO), sell one-third of the position at $77.20 or better and keep the stop at $71.22 on the remaining position.


