News and downward pressure from Europe has driven Apple (AAPL) and the major US stock indices sharply lower, but a potential short-covering rally could present select new buying opportunities.
Relentless selling over the past week has taken the S&P 500 below the widely watched 1340 support level and caused a significant change in market sentiment.
In April, I posed the question, "Will Europe Spoil Apple's Party?" This was after Apple Inc. (AAPL) rebounded $60 per share and analysts were projecting upside targets from $700 to as high as $1000. My skepticism was based on the deterioration in the market internals like the Advance/Decline (A/D) line and the fact that the widely watched German DAX Index and the Euro STOXX 50 had broken key support two weeks earlier.
Stocks tried to stabilize late last week, but the news of the $2 billion loss from JPMorgan Chase (JPM) and more bearish news from the Eurozone hammered stocks on Monday. This has caused further technical damage, which I will discuss below, but the extreme negative A/D numbers from Monday favor a sharp rebound in the near future.
This should momentarily scare those on the short side and give investors and traders an opportunity to establish new positions. The notes from the FOMC meeting due for release later today should be watched closely as well.
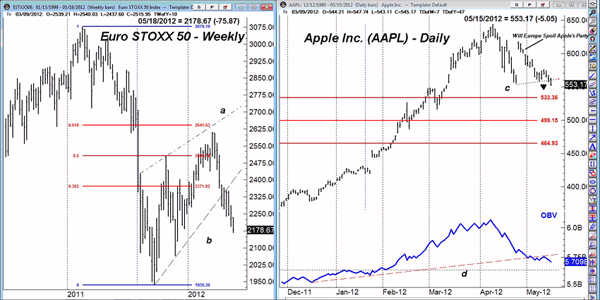
Chart Analysis: The weekly chart of the Euro STOXX 50 Index, which is the Eurozone's blue-chip average, completed its flag formation (lines a and b) in mid-April. The index was down more than 13% in April and has dropped over 29% from the early-2011 highs.
- The drop below the 50% Fibonacci support at 2,271 favored a drop to the 61.8% support at 2,191
- The close on Tuesday was below this retracement level with next support in the 2070 area and then at 1935, which was the September 2011 low
- There is now heavy resistance in the 2340 area and then at 2430
Apple Inc. (AAPL) was down 7.7% in April and over 14% from the April 10 high of $644. Tuesday's close was below short-term support at line c, which is likely to increase the short-term selling pressure.
- The 38.2% Fibonacci retracement support from the October 2011 lows is at $533
- AAPL declined $89 from the April highs to the April lows, and an equal decline from the April 25 high at $618 projects a move to $529
- The 50% retracement support stands at $499
- Weekly relative performance, or RS analysis (not shown), indicates that AAPL is still outperforming the S&P 500
- Daily on-balance volume (OBV) broke its uptrend, line d, in early May and is still negative
- Weekly OBV (not shown) is still above its weighted moving average (WMA)
- There is first resistance at $575 with stronger resistance at $595-$600
NEXT: Latest Technical Action for S&P 500, Nasdaq 100
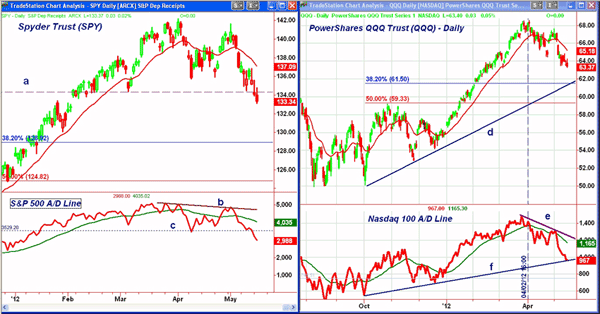
|pagebreak|The Spyder Trust (SPY) closed near the lows on Tuesday and is back to the late-January high at $133.40. There is further support in the $130 area. SPY is down 6.2% from the early-April high.
- The 38.2% Fibonacci retracement support is at $128.90, which is likely to be tested before the market's decline is over
- The S&P 500 A/D line formed a slight negative divergence at the April highs and has well-defined resistance now at line b
- The break in the A/D line below the April lows, line c, was negative and confirmed a new downtrend
- The distance of the A/D line from its weighted moving average and the -206 reading on the McClellan oscillator indicates the market is clearly getting oversold
- There is now first strong resistance at $135.80-$136.40, which is about 1.8% above Tuesday's close
- Stronger resistance is in the $137.50-$138 area and then at $139.40
The PowerShares QQQ Trust (QQQ), which tracks the Nasdaq 100, lost more than 6% in April but is still up 21% for the year.
- The uptrend from the October lows, line b, is at $62.30, and the 38.2% Fibonacci retracement support is at $61.48
- More important 50% retracement support is at $59.33, which corresponds to the October 2011 highs
- Nasdaq 100 A/D line formed a slight negative divergence at the April highs that was confirmed by the drop below the March and April lows
- A/D line is now testing the uptrend from the October lows, line f
- The A/D line now has key resistance at its declining weighted moving average and the downtrend, line e
- There is initial resistance for QQQ now at $64.80-$65 with the declining 20-day exponential moving average (EMA) at $65.18
- Further resistance is at $66-$66.80 and the daily downtrend, line a.
What It Means: Stock index futures were lower in early-Wednesday trading but turned higher just before the opening. The sentiment has turned significantly more bearish in the past week, and those on the short side are looking a bit too complacent.
The negative readings from market indicators including the A/D lines suggest
a further decline over the coming weeks. Before the Spyder
Trust (SPY)
can test the $130 area, a sharp short-covering rally is likely that would reduce
the market's oversold status and the high bearish sentiment.
The
rally should be an opportunity for traders and investors to add to positions in
the inverse ETFs and lighten up on those stocks that are underperforming the
S&P 500.
How to Profit: Our buy recommendations for the ProShares Short Russell 2000 ETF (RWM) and the ProShares UltraPro Short QQQ (SQQQ) from last week were just missed, and these orders should now be cancelled.
For the ProShares Short Dow 30 (DOG),
go 50% long at $36.24 and 50% long at $35.96 with a stop at 34.84 (risk of
approx. 3.5%).
There is no new recommendation for Apple
Inc. (AAPL) at this time, as I will be looking for signs of a bottom
before buying.
Portfolio Update: Buyers should be 50% long the ProShares Short S&P 500 ETF (SH) at $36.26 and 50% long at $36.06 with a stop now at $35.92.


