Without a sharply stronger close on either side of Memorial Day, the likelihood of a deeper correction will grow, further delaying the window for new buying until a short-term bottom is formed.
Just a couple hours before Thursday’s close, the S&P 500 E-mini futures were trading down almost ten points and near the day’s lows. But as was the case on Wednesday, when the futures closed 20 points above the day’s lows, stocks finished on a firm note.
This is typically the type of market action that would be expected prior to the completion of a short-term bottom. There are also some encouraging signs from market leader Apple Inc. (AAPL) that suggest that it may be closer to completing its correction.
Heading into the long holiday weekend, the major averages need a solidly higher close to set the stage for a rebound that could take us to the end of the month. The technical damage from the sharp recent market decline will take some time to repair, so buyers will have to be selective with any new positions.
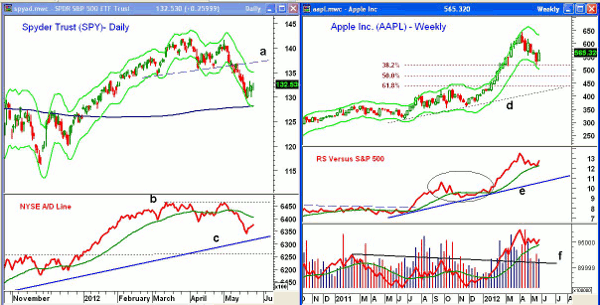
Chart Analysis: The daily chart of the Sypder Trust (SPY) shows that the daily Starc- band was tested early in the week while prices have been trying to stabilize over the past few days.
- A daily close above the resistance at $134 would be a short-term positive. There is more important resistance in the $135.50-$136.50 area
- Major resistance is in the $137 area, line a
- The daily Starc- band and the still-rising 200-day moving average (MA) are both in the $128-$127.50 area
- The NYSE Advance/Decline (A/D) line has risen slightly from the lows but is still well below its declining weighted moving average (WMA) and resistance from the April lows
- A/D line is still holding above the longer-term uptrend, line c, and important support from the November highs
- The A/D line needs to surpass major resistance at line b to signal that the market’s decline is over
The weekly chart of Apple Inc. (AAPL) shows that the weekly Starc- band was tested last week with the 38.2% support level at $516.
- The more important 50% support level, as calculated from the 2011 lows at $310.50, is at $477
- Relative performance, or RS analysis, is holding above its weighted moving average and has turned higher this week
- The chart shows that a similar corrective pattern in the RS last year (see ellipse) preceded the powerful rally in early 2012
- Weekly on-balance volume (OBV) has also just pulled back to its rising weighted moving average
- OBV staged a major upside breakout last year when it overcame resistance at line f
- Daily OBV (not shown) is still negative and below its weighted moving average
- The 50% retracement resistance, as calculated from the high at $644, is at $582.50 with stronger resistance at $594-$600
NEXT: Can the Nasdaq 100 Find a Bottom?
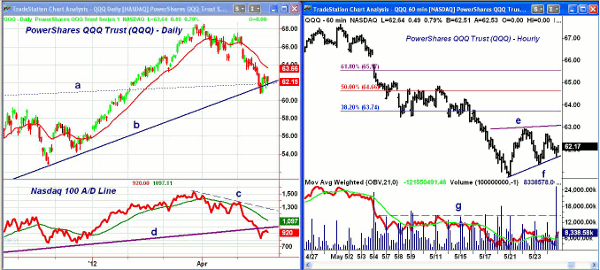
|pagebreak|The decline seen in the PowerShares QQQ Trust (QQQ) has been more severe than that of the Spyder Trust (SPY) since the start of April. Very weak earnings from Dell, Inc. (DELL) this week and the resulting plunge in its stock price did not help.
- A week ago, QQQ closed below the weekly uptrend, line b, and violated the support from the 2011 highs, line a
- There is now additional support in the $59.50-$60.50 area
- The Nasdaq 100 A/D line formed a slight negative divergence at the early-April highs and now shows a well-established downtrend, line c
- A/D line has broken its uptrend, line d, and is still acting weaker than prices
- The declining 20-day exponential moving average (EMA) is now at $63.66
The hourly chart of the PowerShares QQQ Trust (QQQ) shows a slight uptrend from Monday’s lows, line f.
- A move above the hourly resistance at line e is needed to suggest that this week’s action is not just a pause in the downtrend
- From the high at $68.55, the 38.2% Fibonacci retracement resistance is at $63.74 with the 50% level at $64.66
- There was a sharp surge in volume on Thursday and QQQ was up during that period
- A move in the OBV above resistance at line f would be positive
- Key support now stands at $61.30, and if violated, it would complete the flag formation (lines e and f) and signal a move to the $59.50 area
What It Means: A week ago, the technical evidence suggested that a rebound was likely. Without a stronger close either Friday or next Tuesday, however, the chance of another drop to new correction lows would increase. This should create a short-term low that will set the stage for a more significant rebound in stock prices.
The bottom line is to not get too negative at current levels, and be looking for new stocks to buy on a drop below the recent lows.
For Apple Inc. (AAPL), there should be another decline back to or below the recent lows before its correction is over, and this should set up a good buying opportunity.
How to Profit: For Apple Inc. (AAPL), our previous buy level at $519.28 was just missed. Now, go 50% long at $521.48 and 50% long at $508.64 with a stop at $473.30 (risk of approx. 7.9%).
For the PowerShares QQQ Trust (QQQ), go 50% long at $59.74 and 50% long at $59.34 with a stop at $56.78 (risk of approx. 4.6%).
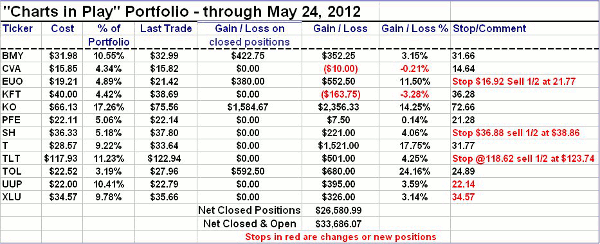
Portfolio Update: Buyers should be 50% long the ProShares Short S&P 500 ETF (SH) at $36.26 and 50% long at $36.06 with a stop now at $36.88. Sell half the position at $38.86 or better.
More: View the Complete "Charts in Play" Portfolio
|pagebreak|


