The currency markets have been quiet lately, but the weekly technical action in three different currency ETFs suggests there are new opportunities on both the long and short sides, writes MoneyShow's Tom Aspray.
The major US markets look ready to reopen Wednesday, but don't expect business as usual. The stock index futures saw a flurry of short covering early Monday before they closed, and they are higher in early trading Wednesday. It looks as though the nervous short sellers were right.
Many of the overseas markets, like the German Dax, have rallied while the US market has been closed. The Dax is up 1.3% from last Friday's close. Gold prices are also edging higher, but a sharper rally is needed to confirm that gold's correction is over. I continue to view the recent correction as a buying opportunity.
Some of the overseas stock markets have started to act better than the US market, but which currencies have the best potential to appreciate?
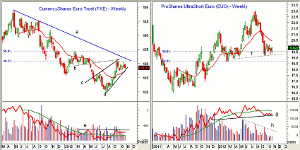
Chart Analysis: The CurrencyShares Euro Trust (FXE) bottomed in July just below $120 and hit a high of $130.85 just as the US stock market was making its high in the middle of September.
- This high corresponds to the 38.2% Fibonacci retracement resistance from the 2011 high at $148.81.
- The weekly downtrend (line a) is in the $131.80 area, with the 50% retracement resistance at $134.27.
- The weekly chart shows that FXE formed a continuation pattern early in 2012, as the break of support (line b) signaled another wave of selling.
- Now another flag formation (lines c and d) appears to be forming. A break below $127 will suggest the rally is over.
- There is additional support now in the $123.50 to $124 area.
- The weekly OBV is above its WMA, but still has strong resistance at line e, which needs to be overcome to turn positive.
The ProShares Ultrashort Euro (EUO) is a double-short leveraged ETF that tracks the dollar price of the Euro. It peaked in July at $23.04, then dropped below its 50% Fibonacci retracement support at $19.54.
- The weekly chart now shows support in the $19.20 area, with the 61.8% Fibonacci retracement support at $18.71.
- The weekly OBV did confirm the July highs and is now trying to hold support (line g).
- The volume has been declining on the recent decline (line h), which is a positive sign.
- There is initial resistance at $20.20, and a weekly close above this level would be the first sign that the correction is over.
- The declining 20-day EMA is at $20.40, with much stronger resistance around $21.35 to $21.50.
NEXT: From Europe to a Global View
|pagebreak|The weekly chart of the CurrencyShares Australian Dollar Trust (FXA) shows quite a volatile pattern over the past two years. Of course, the Australian economy is very sensitive to commodity prices, and is used by some as a barometer of the global economic outlook.
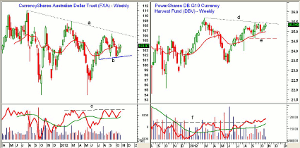
- FXA dropped to a low of $101.57 (line b) after the recent 0.25% rate cut by the Reserve Bank of Australia.
- There is additional support in the $100 to $100.50 area.
- The weekly on-balance volume (OBV) moved above its WMA in July. A breakout above the resistance (line c) would be a sign of strength.
- The daily OBV (not shown) is above its WMA, but still locked in a trading range.
- There is resistance now at $104.80 to $105, with the weekly downtrend and the recent high at $106.40.
The PowerShares DB G10 Currency Harvest Fund (DBV) which takes long positions in the three G10 currencies with the highest yield and short positions in those with the lowest yield.
- DBV closed firm last week, with next resistance at $25.46 (line d) and the high from early in 2012 at $25.68.
- The weekly chart shows a tight range recently, with the recent low and the rising WMA at $25.
- There is more important support (line e) in the $24.65 area.
- The weekly OBV is acting stronger than prices, as it moved above the resistance (line f) in August.
- The OBV is holding well above its WMA, and the daily OBV (not shown) is also positive.
- If the support at $25 is broken, the 38.2% retracement support level is at $24.65, with the 50% Fibonacci retracement support at $24.46.
What it Means: Though stocks have corrected from the September highs, the increased negative sentiment seems to be more dramatic than the price decline.
Early in the month, I poised the question "Is the Stock Market Right About the Economy?" as the higher stock prices could be interpreted as a sign that the economy was really stronger than most think.
The recent economic data, including last Friday's GDP report, has been stronger than most have expected. Also, there has been some encouraging news out of China. This makes the CurrencyShares Australian Dollar Trust (FXA) look attractive for more aggressive accounts.
Though I am not one that expects a break up of the Eurozone, technically it does look as though the euro is ready to resume its decline, and the short side is favored.
How to Profit: For ProShares Ultrashort Euro (EUO), go 50% long at $19.70 and 50% long at $19.42, with a stop at $18.56 (risk of approx. 5%).
For the CurrencyShares Australian Dollar Trust (FXA), go 50% long at $103.58 and 50% long at $102.74, with a stop at $99.44 (risk of approx. 3.6%).
For the PowerShares DB G10 Currency Harvest Fund (DBV), go 50% long at $25.21 and 50% long at $25.06, with a stop at $24.23 (risk of approx. 3.6%).


