
The stock market faces additional headwinds as it attempts to break through recent highs and MoneyShow’s Tom Aspray examines the technical evidence for insights into what’s ahead.
The sharply lower weekly close in the major averages last week was consistent with the deterioration in the technical studies, especially the market internals. These indicators, as well as the OBV on key ETFs like the Spyder Trust (SPY) have now broken support and are below their declining WMAs. Most are also testing their daily starc - band so they are currently in a high-risk sell zone.
In Friday’s market analysis, I noted that the technical formations typically favor a one- or two-day rebound this week, which will take the indicators and prices back to first resistance. The McClellan oscillator closed moderately oversold last Friday at -240, which also favors a bounce in the NYSE over the near term.
The Nasdaq 100 has recently been one of the strongest market averages and only dropped 1.3% last week. This was much better that the 2.1% loss in the Spyder Trust (SPY) but the highest flying stocks were hit even harder. The Investor’s Business Daily average of 50 growth stocks or the IBD 50 lost 2.8% for the week.
A technical look at the four biggest losers in this index may give us some additional insight of what is likely to occur in the weeks ahead.
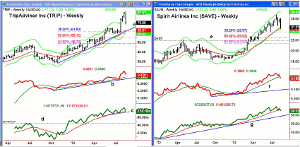
Click
to Enlarge
Chart Analysis: TripAdvisor Inc. (TRIP) has a market capitalization of $10.51 billion as it was spun off from Expedia Inc. (EXPE) in 2011. Comments from its CEO last week regarding weak summer travel trends triggered some heavy selling.
- The stock was down 12.3% for the week as it had closed above its weekly starc+ bands for the prior three weeks indicating it was a high-risk buy.
- From the all-time high at $82.19, it is now down 13.6% but is still 12% above the weekly uptrend (line a).
- The major 38.2% Fibonacci retracement support is at $61.50.
- The weekly starc- band is at $59.44 with the 50% support at $55.12.
- The relative performance did confirm the recent high but has now turned lower.
- The RS line is well above its WMA and the uptrend, line b.
- The on-balance volume (OBV) made marginal new highs with prices two weeks ago and is now testing its WMA.
- The OBV broke through resistance at line d, late last year.
- The quarterly pivot at $70.25 has been tested with initial resistance now at $75.40-$77.
Spirit Airlines Inc. (SAVE) has a market cap of $2.27 billion and has had a dramatic rally from the November 2012 low at $15.64.
- The weekly starc+ band was tested three weeks ago when SAVE made its high at $36.83.
- The 20-week EMA is now being tested with the weekly starc- band at $29.37.
- The 38.2% Fibonacci support is at $28.57 with the 50% support level at $26.02.
- The relative performance had dropped below its WMA after confirming the recent price highs.
- The longer-term support for the RS line is at line f.
- The weekly OBV shows a similar formation and closed last week below its WMA.
- The OBV is still well above the longer-term support at the uptrend, line g.
- There is initial resistance at $32.20-$32.75 with the quarterly pivot at $33.77.
NEXT PAGE: What It Means
|pagebreak|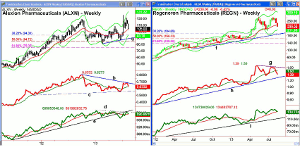
Click
to Enlarge
Alexion Pharmaceuticals (ALXN) has been one of the powerhouses of the biotechnology sector as it is up 53% over the past three years versus 28% for the sector. It has a market cap of $20.43 billion.
- ALXN spiked to a high of $125.65 on July 12 on buyout rumors and moved well above its weekly starc+ band.
- It closed down 8% last week and right on the 20-week EMA. It is now down 16.4% from its high.
- The 38.2% Fibonacci retracement support from the 2011 lows is at $94.38 with the starc- band at $93.76.
- The weekly trend line support, line a, is at $89.09 while the 50% support is at $84.72.
- The relative performance formed lower highs in July, line b, and did not confirm the price action.
- The RS line is now testing its WMA with more important support at line c.
- The weekly OBV broke its uptrend, line e, at the end of May.
- This uptrend has just been retested and the OBV did not confirm the new highs, line d.
- There is initial resistance now at $108-$109 with the quarterly pivot resistance at $111.72.
Regeneron Pharmaceuticals (REGN) is another large ($22.57 billion) biotechnology company that is up 113% in the past three years. The high in July at $282.27 failed to surpass the May high of $283.99.
- The close last week was below the 20-week WMA and the quarterly pivot at $231.03.
- REGN is down 18.6% from the highs.
- The weekly starc- band is at $211.96 with the 38.2% Fibonacci retracement support at $194.09.
- The weekly uptrend (line f) is now at $187.74 with the 50% retracement support at $166.33.
- The relative performance shows a pattern of lower highs, line g, and has now dropped below its WMA.
- The RS line has further support at the uptrend, line h.
- The weekly OBV made marginal new highs in July but has now pulled back to its rising WMA.
- There is longer-term support for the OBV at line i.
- Last week’s high at $249.15 is the initial resistance with further at $259-$267.
What It Means: The nervousness about the stock market makes those stocks with the most dramatic gains and the highest P/E ratios the most vulnerable. All four of these stocks are likely to move even lower in the coming weeks. Over the short term, a rebound is likely.
A test of their major 38.2% support is quite likely. Spirit Airlines Inc. (SAVE) and Alexion Pharmaceuticals (ALXN) could finally bottom out between the 38.2% and 50% support levels, which are often a high-probability entry level.
How to Profit: No new recommendation for now.


