As the stock market stumbled for the sixth day in a row, MoneyShow's Tom Aspray takes a technical look at yesterday's largest losers for clues on how much lower they can fall.
The market was disappointed with the lack of clarity from the FOMC minutes yesterday, which kicked up the level of fear and generated heavier selling. The market internals were about three to one negative with 73% of the volume coming in on the downside. A higher level of fear is needed to create a better buying opportunity later this year.
Crude oil was also lower, and as I suggested Tuesday, the drop in crude oil Monday might have been warning of a drop in stocks. For those who have not read my prior articles on the correlation between crude oil prices and the S&P 500, oftentimes crude will top or bottom out a few days ahead of stocks.
During a market correction, it is important to take note of which sectors and stocks are dropping the most, as well as those that are bucking the trend. It is also important to look at the volume levels of both the winners and losers.
One of the biggest winners Wednesday was Trina Solar ADS (TSL) as it gained 14.7% on four times the average volume. A technical look at four of the largest losers, including Staples, Inc. (SPLS), which was down 15.2% on 45 million shares, can give us an idea how much lower these stocks may drop.
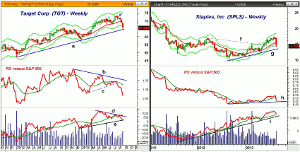
Chart Analysis: The drop in consumer confidence and weaker earnings by the department stores has caused many to doubt the health of the retail sector. Target Corp. (TGT) was down 3.6% Wednesday on four times the average volume.
- The weekly chart shows that an LCD sell signal was triggered one week after the high. Yesterday's close was at the lower weekly starc- band.
- It is now just above the uptrend, line a, at $64.67
as it is back to the highs from last fall.
- More important chart and retracement support is in
the $60-$63 area.
- The relative performance formed a negative divergence
at the April highs, line b, and then broke support (line c) at the end of
July.
- The weekly OBV also formed a bearish divergence, line
d, and is now on the verge of breaking its uptrend (line e).
- There is first strong resistance now in the
$67-$67.40 area, which corresponds to the May and June lows.
Staples, Inc. (SPLS) closed well below the starc- band at $15.12. The weekly uptrend is now at $13.41.
- There is further support from early in the year in
the $12 -$12.50 area.
- The correction is now also retesting the former
downtrend, line f.
- The relative performance has reversed to the downside
as it has dropped below its WMA.
- The RS line has further support at line h.
- The on-balance volume (OBV) has been acting stronger than
prices for the past two years as it is in a strong uptrend, line i.
- The support at the rising WMA is still holding,
suggesting that it is possible that the current drop is part of a long-term
bottoming process.
- There is strong resistance now in the $15.50-$16
area.
NEXT PAGE: What It Means
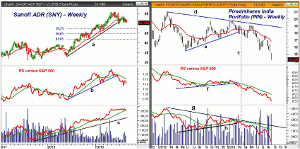
|pagebreak|Not even the very strong health care sector was immune as Sanofi ADR (SNY) dropped 3% on 6.4 million shares, which was almost five times the average of 1.3 million shares.
- The weekly uptrend, line a, was broken in late June
and the rebound failed at the 61.8% retracement resistance.
- SNY is now down 10.3% from the high at $55.94.
- The major 38.2% Fibonacci support from the 2012 low
is at $47.22.
- The more important 50% support is at $44.49.
- The relative performance broke its uptrend, line b, along
with prices and then rebounded back to its WMA.
- The RS line is line now in a well-established
downtrend.
- The OBV is still barely above its WMA and well above
the longer-term support at line c.
- This week's high at $52.11 is just above the
quarterly pivot at $52.11.
Powershares India Portfolio (PIN) has had a rough year as the news out of India goes from bad to worse. This week their currency dropped even further.
- The weekly chart shows a breakaway gap as it was down
over 6% Wednesday on 4-? times the average volume.
- The weekly uptrend, line e, was broken in February,
which was a strong warning.
- Prices rebounded to the downtrend, line d, before
collapsing.
- The relative performance dropped through its support
at line f in early February warning of future weakness.
- By early March, the OBV had also violated the support
at line h.
- Both indicators were clearly negative in the middle
of March when PIN was trading at $18.69.
- The support from late 2008 and early 2009 is in the
$13.50 to $9.50 area.
What It Means: The market has clearly caught the cold I was talking about last week but it should be ready for a bounce soon. Some analysts seem OK with a 5% decline, which means it may drop considerably more.
The strength of the first rebound will tell me more, but of the four stocks, only Sanofi ADR (SNY) and Staples, Inc. (SPLS) will be on my monitor list. Both still are likely to drop further over the near term but could turn around by the end of the year.
How to Profit: No new recommendation


