The sell-off that started with taper tantrums, intensified yesterday over fears of US involvement in the Syrian conflict, and MoneyShow's Tom Aspray examines the ripple effect on emerging markets.
As suggested by the technical evidence after Monday's close, stocks got hammered on Tuesday with very negative market internals as the ARMs Index closed at 2.47, reflecting heavy selling pressure. Asian markets were also weak as many were down well over 1%. Similar losses in early European trading but the US stock index futures are up slightly in early trading.
The next major support for the S&P 500 is in the 1600-1610 area, which is the next potential downside target. It would take a powerful upside reversal, Wednesday, to slow the downside momentum. If prices stabilize today, it will likely set the stage for another push to the downside and Thursday's GDP data will be watched closely.
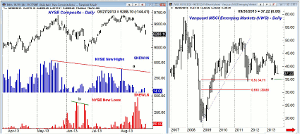
It is always important to watch both the NYSE new high and new lows data no matter what stage the market is in. In an earlier trading lesson, Tracking the Market's Trend, I discussed how this data could be used to determine the market's trend, and it has been negative for several weeks. There was no large spike in new lows yesterday but the new highs data has been deteriorating since June.
Looking at the stocks that were making new lows, there were several emerging market entities, as well as several key emerging market stocks. In Friday's A Contrary Bet For 2014?, I made the case that sentiment on emerging markets had become so negative that they could bottom out before year end.
Another reason for this view is my opinion that both the improving US and Eurozone economies will also stabilize the emerging market economies. Saturday's New York Times article reviewed the very weak performance of these markets and was another sign that the bearish sentiment was increasing.
So which stocks were on the new low list and what is the current status of the NYSE new high, new low data?
Chart Analysis: The chart of the NYSE Composite shows yesterday's down gap and the close below the prior day's low. The quarterly pivot at 9251 is now being tested and be sure to keep an eye on other key quarterly pivot data.
- The 61.8% retracement support is at 9163 with the June
lows at 8803, line a.
- The NYSE new highs hit 536 in May and then only
reached 402 in early August.
- The pattern of lower highs, line a, suggested that the
market was weakening internally.
- The number of new highs can still drop lower as it did
last June.
- The number of new lows hit 403 on June 16 but only 375
just before the market low in late June.
- The new lows surged to 479 on August 19 but there were
just 80 on Tuesday.
The Vanguard MSCI Emerging Markets (VWO) was my favorite choice for the recommended dollar cost averaging strategy I made in my weekly market summary.
- VWO is still above the 52-week low at $36.02 as it
closed Wednesday at $37.22.
- The projected low for September is at $35.02 with the major 50% Fibonacci retracement support at $34.71.
- The weekly starc- bands is at $33.33.
- The daily and weekly OBV are still negative but the
weekly is well above the 2012 lows.
NEXT PAGE: What It Means
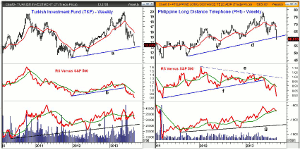
|pagebreak|The Turkish Investment Fund (TRF) tracks the largest Turkish companies and has a total expense ratio of 1.22%.
- TRF is still above the quarterly S1 support at $13.52.
- The chart shows that the sharp drop this week has
brought prices closer to the weekly uptrend, line a, at $13.
- The sideways action in June and July took prices
closer to its declining 20-week EMA.
- The relative performance broke below its support, line b,
at the end of May, which warned of the recent drop.
- The OBV has dropped back below its WMA but does not
yet show evidence of heavy selling.
- There is important support for the OBV at the 2013
lows and the uptrend, line c.
- There is strong resistance in the $15.30-$15.80
area.
The Philippine Long Distance Telephone (PHI) is a $12.86 billion dollar provider of telephone service in the Philippines. It has a current yield of 3.00%.
- The drop on Tuesday was five times the average as the
uptrend from 2011, line d, was broken.
- The lows from 2011 were at $52.33 and then at $46.08.
- The monthly projected support for September is at
$50.72.
- The relative performance formed a long-term negative
divergence, line e, since late 2011.
- The RS line broke its support at the end of May and
just two weeks after the high at $78.63.
- The weekly OBV did confirm the price highs in May as
weekly volume since May had not been that high.
- There is initial resistance at $64.75 to $66.
What It Means: In the early stages of a strong market, the new-highs list can be a good place to look for market leaders and good momentum trades. In a down market, a concentration of stocks in the same sector or class can often be an early sign of the bottoming process.
This decline will certainly cause more panic selling in emerging markets, which is necessary before they can form a significant low. It will also increase the overall negative market sentiment, which I felt two weeks ago was necessary before the stock market could begin a sustainable new uptrend this fall.
How to Profit: No new recommendation


