The monthly review of the stocks in the Dow Jones Industrials reveals which ones are the most oversold, but MoneyShow’s Tom Aspray advises investors to be cautious about their entry level, as they are likely to become more oversold before they bottom.
The performance in the stock market for August will not be forgotten, even after a long weekend, and many are likely more nervous about what may happen in September. Unless you have been living in a cave for the past month, you know that historically September is the worst month for stocks.
While the technical outlook is still negative for the stock market, that does not mean they have to close lower for the month. In fact, the short term historical record is much better. Since 2003, the S&P 500 has closed lower only three months and has been higher for seven years with an average gain of 3.7%.
The individual investors turned a bit more positive last week, as 33.5% were bullish compared to 28.9% the prior week. As I mentioned a few weeks ago in Why More Taper Tantrums Will Be Bullish a greater degree of negative market sentiment, I think, is needed to support a sustainable market rally.
For most of 2013, the relative performance analysis has indicated that the Dow Industrials was weaker than the S&P 500, though it was only down 4.4% in August versus a 5.7% drop in the S&P 500.
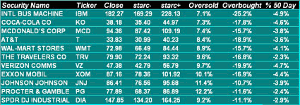
The monthly starc band scan of the 30 Dow stocks looks at where the 30 closed August, in relation to their starc bands. If a stock closed near its upper starc band (starc+), it is considered to be a high-risk buy and overbought. Conversely, closeness to the lower starc band (starc-) indicates that a stock is a high risk sell or oversold.
Of course, that does not mean that an overbought stock can’t go higher or an oversold stock can’t go lower. Therefore, once I have the scan results, I look at how the stocks are performing versus the S&P 500, and also analyze their monthly, as well as their weekly, volume patterns.
For example, International Business Machines (IBM) leads the list, as it is just 7.1% above its monthly starc- band. I have also included how these stocks closed the month relative to their 50-day MAs, as IBM is 4.9% below its 50-day MA.
In the case of IBM, it had its lowest monthly close in over a year, which does make it vulnerable to a further decline from current levels. Let’s look at four of the most interesting oversold Dow stocks, as three look attractive if they reach lower levels this month.
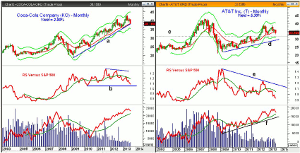
Chart Analysis: Coca-Cola Company (KO) closed the month on its 20-month EMA and the uptrend (line a) that goes back to the 2009 lows.
- It is down just over 12% from the May high of $43.43 when it tested the monthly starc+ band.
- The early 2013 low of $35.58 now represents key support with the monthly starc- band at $35.50.
- The monthly relative performance formed lower highs in 2012 but is still above key support at line b.
- The monthly on-balance volume (OBV) is acting much stronger, as it made new highs in June.
- Both the weekly RS and OBV analysis (not shown) are negative and show no signs yet of bottoming.
- There is initial resistance at $38.91, which is the monthly pivot.
- More important resistance is in the $39.70-$40 area.
AT&T Inc. (T) made a marginal multi-year high at $39 in late April before turning lower. The 20-month EMA was broken last month, but it closed the month above it.
- The stock is now down 13.2% from its 2013 high.
- The 2013 low is at $32.76 with chart support, line c, in the $32 area.
- The monthly starc- band is at $30.99.
- The long-term monthly uptrend, line d, is now at $29.40.
- The relative performance shows a pattern of lower highs, line e.
- The RS line has also now dropped below the 2011 highs, while the weekly (not shown) does show signs of bottoming.
- The OBV did make new highs in April, and is acting stronger than prices, and is still well above its WMA and support, line f.
- The weekly OBV (not shown) is below its WMA.
- There is initial resistance in the $34.90 to $35.40 area.
NEXT PAGE: What It Means
|pagebreak|Verizon Communication (VZ) is leading the news before the opening, as it has agreed to pay $145 billion to Vodafone for their 45% stake in Verizon. The stock is down over 3% before the opening.
- The stock exceeded its monthly starc+ band in both April and May.
- From the May high at $54.31, the stock has dropped 12.7% from its high.
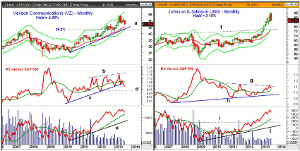
- The 20-month EMA is at $45.81 with the uptrend, line a, at $44.
- The 38.2% support from the 2010 lows is at $43.31.
- The relative performance did make higher highs in May, line b, but has now broken its uptrend, line c.
- The RS line has key support, line d, at the 2012 lows.
- The OBV did confirm the 2013 highs and is holding well above its rising WMA.
- The major support for the OBV, line e, is significantly lower.
- The weekly chart (not shown) reveals that two dojis have formed over the past two weeks.
- There is initial resistance now in the $48-$49 area.
Johnson & Johnson (JNJ) closed July at $93.50, which was above its monthly starc+ band. The August high at $94.40 also tested the starc+ band before it closed the month on the lows.
- JNJ is now down 9% from its highs with the June low at $82.12.
- The long-term chart support is at $76.80 with the rising 20-month EMA at $75.40.
- The relative performance did slightly surpass resistance, line g, before turning lower.
- The RS line is still well above its rising WMA, with long-term support, line h.
- The monthly OBV did make new highs with prices and looks very strong.
- It is well above the rising WMA and the support, line i.
- The weekly indicators (not shown) did confirm the recent highs, but are now testing support.
- There is first resistance in the $90-$91.30 area.
What It Means: The market internals and volume analysis still look negative for the stock market. There are a few indicators that are oversold as only 10% of the Dow stocks are above their 50-day MAs. By comparison, 30% of the S&P 500 stocks are above their 50-day MAs.
The longer-term measures are not oversold, as 67% of the S&P 500 stocks are above their 200-day MAs with 73% of the Dow stocks above their 200-day MAs.
Of the four stocks, all except Coca-Cola Company (KO) look attractive for purchase on a further correction, but I will also be watching KO when the market bottoms out.
How to Profit: For AT&T Inc. (T), go 50% long at $32.88 and 50% long at $31.76, with a stop at $30.89 (risk of approx. 4.4%).
For Verizon Communication (VZ), go 50% long at $43.24 and 50% long at $41.90, with a stop at $39.88 (risk of approx. 6.3%).
For Johnson & Johnson (JNJ), go 50% long at $82.76 and 50% long at $80.56, with a stop at $77.77 (risk of approx. 4.7%).


