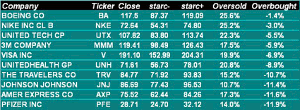
A monthly look at the 30 stocks in the Dow Industrials reveals the ten that are the most overbought based on starc+ band analysis, and MoneyShow’s Tom Aspray likes two of these stocks on a pullback to support.
The stock market managed to shrug off the government shutdown Tuesday and closed with nice gains. The market internals were strong with advancing issues leading the decliners by almost a 3-1 margin. This has improved the short-term technical outlook but not enough to be confident that the market correction from the post-FOMC highs is over.
The overnight action supports a cautious stance as the Asian and Euro markets are trading lower. In early trading, the futures have given up much of Tuesday’s gains but, of course, it is the close today that will be more important. Another positive close Wednesday is needed to stabilize the technical outlook.
In this month’s scan of the stocks in the new Dow Industrials, I wanted to concentrate on those stocks that were closest to their starc+ band or most overbought. Those familiar with the scan analysis know that just because a stock closes the month near its starc+ band, it does not mean they can’t go higher but does tell one that the risk at current levels is high.
Leading this month’s list is Boeing Co. (BA), which closed the month just 1.4% below its monthly starc+ band. This is not surprising as BA is up close to 22% from its June lows. Nike, Inc. (NKE) is second on the list, and it is one of the new additions to the Dow Industrials. It closed September just 3% below its starc+ band.
Oftentimes, there are stocks that show up in the scan that after overcoming major resistance have subsequently pulled back from their highs. There are two stocks like this on the list whose relative performance analysis indicates they are market leaders.
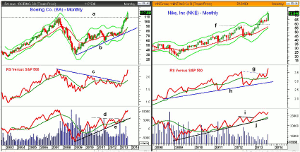
Chart Analysis: Boeing Co. (BA) broke through two-year resistance in early 2013 and has been testing its monthly starc+ band since March. The more months that a stock or ETF tests or exceeds its starc+ band, the more vulnerable it becomes.
- BA is also 25% above its 20-month EMA, consistent with an overextended market.
- The 2007 high at $107.83 was decisively overcome in September.
- The monthly relative performance broke through its downtrend, line c, in March signaling that it was starting to lead the S&P 500 higher.
- Since the end of March, BA is up 36.8% while the Spyder Trust (SPY) is up just 3%.
- The OBV broke through its resistance, line d, at the end of April.
- The OBV shows a strong uptrend from the 2009 lows, line e.
- There is first support in the $116 area with the 4th quarter pivot at $112.26.
Nike, Inc. (NKE) closed above the 2012 high at $57.40, line f, at the end of March.
- The breakout level was tested in June as the low was $59.11 and NKE has surged above the highs from the past four months in September.
- The relative performance overcame resistance at line g at the end of August.
- The RS line held above its WMA on the recent correction and is well above long-term support, line h.
- The on-balance volume (OBV) surged above its previous highs, line i, at the end of January 2013 and led prices higher by several months.
- It is very close to its all-time highs and the weekly OBV (not shown) made new highs last month.
- The 4th quarter pivot is at $69.98 while the October pivot is at $70.48. There is additional support in the $67.77.
NEXT PAGE: 2 Stocks Tom Likes on Pullback
|pagebreak|United Technologies Corp. (UTX) had high of $112.46 the week ending September 20 and formed a doji with a low of $108.91. A close below this level on Friday will trigger a LCD sell signal.
- The monthly pivot is at $107.12 with the quarterly pivot at $104.45.
- This is very close to the short-term 61.8% Fibonacci retracement support from the late August lows.
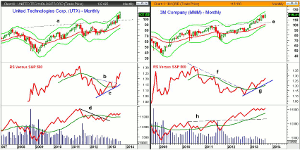
- The monthly chart shows that long-term resistance, line a, at $97 was overcome at the end of July.
- The initial upside targets from the formation are in the $118 area.
- The monthly relative performance moved through its downtrend, line b, at the end of June.
- The RS line shows a clear uptrend, line c.
- The monthly OBV surpassed its uptrend, line d, at the end of the year and closed above its WMA the following month.
- The weekly RS and OBV are holding above their WMAs.
3M Company (MMM) closed the month 5.9% below its monthly starc+ band as it closed above resistance from 2011, line e, at the end of February.
- The monthly chart shows a very narrow range from July to December 2012 when the RS line broke its downtrend, line f.
- The RS line shows a solid uptrend, line g, and is acting stronger than prices.
- The monthly OBV broke out to two-year highs, line h, in February of 2012.
- The OBV is well above its rising WMA and continues to act stronger than prices.
- The weekly OBV made new highs last week and confirmed the price action.
- There is initial support at $118.18 and the monthly pivot.
- The 4th quarter pivot is at $116.69 with more important support in the $115.50 area.
What it Means: Both United Technologies Corp. (UTX) and 3M Company (MMM) have pulled back from their highs and look attractive for new purchase on a drop back to stronger support as recommended below.
I would suggest that holders of Boeing Co. (BA) take some profits or look to protect their positions, so they are prepared for a sharper pullback in the coming months.
How to Profit: For United Technologies Corp. (UTX), go 50% long at $105.44 and 50% long at $102.16, with a stop at $99.31 (risk of approx. 4.3%).
For 3M Company (MMM), go 50% long at $117.74 and 50% long at $115.46, with a stop at $111.87 (risk of approx. 4.1%).


