
It is easy to lose sight of the forest for the trees, so MoneyShow’s Tom Aspray recommends reviewing your holdings regularly to make sure you have a game plan in case of large declines.
It was another rough opening for the stock market on Wednesday with the Dow trading down as much as 147 points before closing down just 58 points. The S&P 500 had a low of 1680.34 before closing at 1693.87. The September reading on the ISM Manufacturing Index at 56.9 was the highest in 29 months. This, combined with the news of the late meetings in Washington, helped support the stock market. The Comex gold futures also had a wide range of almost $50 before closing with the $34 gain.
The late buying is normally a positive sign for the markets, yet the declining stocks led the advancing, which has kept NYSE Advance/Decline within its recent trading range. On a short-term basis, a move in the Spyder Trust (SPY) above $170.65 will shift the focus to the upside while a break of $166.80 would be negative.
Between now and the debt ceiling deadline, the market is likely to remain choppy, therefore, it is important to protect your long positions with stops but they should not be too tight. There are quite a few stocks and industry groups that are acting quite well, like the homebuilders, which posted nice gains on Wednesday. They are likely to be market leaders once its major uptrend resumes.
In reviewing September’s action, I would like to take a look at two of the recommendations that are currently working well and also at two recommendations that were stopped out.
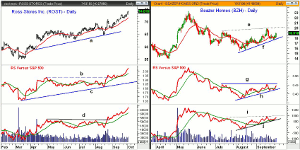
Click to Enlarge
Chart Analysis: Ross Stores Inc. (ROST) was recommended in late August and gained over 8% in September.
- It has been strong, so far, in October as it is trading well over the quarterly pivot at $70.77.
- The monthly starc- band is at $75.43 with the quarterly R1 resistance at $76.91.
- This is the next resistance zone to watch.
- The daily relative performance broke through its resistance, line b, in August. This signaled that it was becoming a market leading sector.
- The on-balance volume (OBV) staged a similar upside breakout in August as it has moved well above the resistance at line d. It is rising very sharply.
- The weekly OBV and RS analysis (not shown) are also both positive.
- The monthly pivot is at $71.04 so there is important support now in the $70-$71 area.
Beazer Homes (BZH) is part of the homebuilding group that I reviewed in depth last August.
- BZH shows a pattern of higher lows, line f, as the uptrend was again tested last week.
- BZH closed on October 1 above the quarterly pivot at $17.97, which is a positive sign.
- The short-term 127.2% Fibonacci target is at $20.46, which is just above the quarterly R1 at $20.40.
- The relative performance has moved back above its WMA but needs to overcome the resistance at line g to complete the bottom formation.
- The uptrend in the OBV, line j, suggests accumulation with important resistance now at line i.
- The weekly OBV (not shown) is not above its WMA so the multiple time frame analysis is mixed.
- There is further support in the $17.60-$17.80 and then at $17.
NEXT PAGE: 2 September Drops
|pagebreak|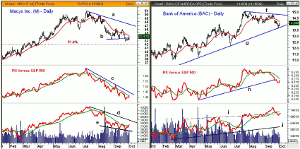
Click to Enlarge
Macy’s Inc. (M) has been a favorite retail pick for many years but the apparent double bottom formation, line b, was broken on September 25.
- The 50% retracement support from the January 2012 lows was at $43.52 with the 61.8% support at $41.81.
- The relative performance turned negative in July when it started a new downtrend.
- The RS line is still well below its downtrend, line c, and its WMA is still declining.
- The OBV has moved above its WMA but has formed lower lows, line e.
- The OBV needs to move through its downtrend, line d, to turn positive.
- The declining 20-day EMA is now at $44.28 with the quarterly pivot resistance at $45.63.
- A close above the early September high of $46.18 would be a very positive sign.
- The daily downtrend, line a, is now at $47.20.
Bank of America (BAC) was recommended in the middle of September as it appeared that the correction from the July high at $15.03 was over.
- The problems facing some of the other big banks hit BAC, as well, as it dropped to a low of $13.60 at the end of the month.
- This was below the minor 50% support but above the 61.8% support at $13.39.
- BAC is now back above the quarterly pivot at $13.89 with stronger resistance in the $14.30-$14.50 area.
- The uptrend in the relative performance, line h, was broken last week and the RS line is still below its WMA.
- The OBV did make new highs in September before reversing and dropping below its WMA.
- The OBV is now in an area of better support, line I, with major at line j.
What it Means: The recommendation to buy Ross Stores Inc. (ROST) is a good example of how buying an overbought stock on a pullback can be a good strategy. One of the overbought stocks in yesterday’s column 10 Overbought But Strong Dow Stocks has already hit its initial buy zone.
The homebuilding stocks and ETFs need a further rally to complete a bottom but they are acting positive.
As for Macy’s Inc. (M), I was looking to buy in the 38.2% to 50% support zone, which is often a good strategy. The decline was more severe than I expected, but I sill think the stock will be higher by year-end.
The problem with Bank of America (BAC), in hindsight, was the entry level which was too high. Buying closer to where my stop was placed and being more patient would have been a better approach.
How to Profit: No new recommendation.
Portfolio Update: For Ross Stores, Inc. (ROST), now 50% long at $68.08 and 50% at $67.43, use a stop at $69.57.
For Beazer Homes USA (BZH), now 50% long at $17.91 and 50% long at $17.27. Raise the stop to $16.86 and sell 1/3 at $20.22 or better.
NEXT PAGE: The Charts in Play Portfolio
|pagebreak|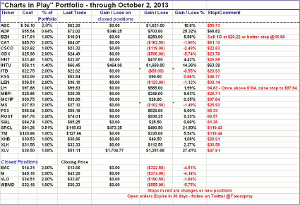
Click to Enlarge


