
Although the financial sector had a good year, expectations are low for big banks’ earnings, and MoneyShow’s Tom Aspray investigates whether their stocks can withstand the pressure resulting from weak earnings reports.
This has clearly been a rough week for the stock market after last Friday’s somewhat encouraging close. The market internals were weak again Tuesday with the major averages closing on the day’s lows. The Nasdaq Composite, Nasdaq 100, and housing sector were the weakest, losing around 2% on the day. Only the utilities closed higher.
The overnight news that Janet Yellen would be nominated as the new chairman of Federal Reserve supported the markets and the dollar overnight. Some of the short-term market indicators are getting oversold so a rally is overdue. The futures and Euro markets are mostly higher in early trading. The fear level has increased as yields on the one-month T-bill hit a five-year high on Tuesday with the VIX up 21.5% in just two days.
As the earning season starts, Alcoa, Inc. (AA) beat its earnings forecast despite softness in aluminum prices. On Friday, we start getting the earnings reports from the major banks including JPMorgan Chase & Co. (JPM) and Wells Fargo & Company (WFC).
These banks have been under pressure as JPM lost almost 2% on Tuesday. A look at the current chart of the financial sector and these three key banks can help us be prepared for the upcoming earning’s reports.
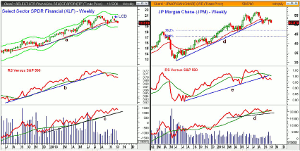
Click to Enlarge
Chart Analysis: The weekly chart of the Select Sector SPDR Financial (XLF) shows that a weekly LCD was triggered three weeks ago.
- The weekly uptrend, line a, and the 20-week WMA were both tested in late August.
- The weekly starc- band is at $18.87 with the June lows at $18.58.
- A decisive close under the June lows could complete a more significant top formation. The relative performance broke its uptrend and WMA in the latter part of August.
- The RS line is now well below its declining WMA.
- The weekly OBV is acting much better as it made new highs in September.
- The OBV is holding above its WMA ands support at line c.
- As I noted previously, XLF did open the quarter below its quarterly pivot at $20.10, which is now key resistance.
JPMorgan Chase & Co. (JPM) has been under fire since its last earnings reports and it is apparently negotiating a multi-billion dollar settlement with the Justice Department.
- The weekly chart does look weaker than XLF as it closed below the uptrend, line d, in August.
- JPM is not far above the key support in the $50 area with monthly projected support at $48.02.
- The 38.2% Fibonacci support from the 2012 lows is at $46.97.
- There is monthly support in the $46 area with the 50% retracement support at $43.88.
- The weekly relative performance dropped below its WMA on August 9.
- The uptrend in the RS, line e, was broken at the end of the month.
- The OBV has been in a narrow range for the past month but is holding above support at line f.
- There is near-term resistance at $52.68 with more important at $53.73.
NEXT PAGE: 2 Other Big Banks Under Pressure
|pagebreak|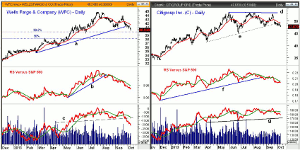
Click to Enlarge
Wells Fargo & Company (WFC) also reports its earnings on Friday as the daily chart shows that the uptrend, line a, was decisively broken last week.
- WFC made a high at $44.78 in July after making a low in late 2012 at $31.25.
- The 38.2% Fibonacci support is at $39.57 with the monthly projected pivot support at $39.57.
- The 50% retracement support stands at $37.97.
- The daily uptrend in the relative performance, line b, was broken in early August.
- The RS line is in a solid downtrend and is below its WMA.
- The weekly RS line (not shown) did confirm the July highs but is also now below its WMA.
- The daily OBV dropped below four month support, line c, last month and is well below its declining WMA.
- The weekly OBV did confirm the highs and is holding above its rising WMA.
- There is initial resistance at $41.57 with the quarterly pivot at $42.35.
Citigroup Inc. (C) reports its earnings next Tuesday, October 15. It had a high last May of $53.56 and then a July high of $53.30. Therefore, the September high at $52.88 could be the last stage in a complex topping formation, line d.
- The support at line e was broken at the end of September and Citigroup started the quarter below its pivot at $49.68.
- There is monthly and quarterly pivot support now in the $46-$46.50 area.
- In June, the low was at $45.50 and a close below this level would be quite negative.
- As Citigroup was rallying in September, the relative performance had already broken the support at line f.
- The daily OBV dropped below its WMA on September 23 with important support at line g.
- The weekly OBV (not shown) is still in a clear uptrend.
- There is initial resistance in the $49 area and once above the quarterly pivot there is stronger resistance in the $51-$52 area.
What it Means: Some fundamental analysts are projecting that the big bank earnings may be down on a year-over-year basis for the first time since 2009. The technical outlook for the financial sector has certainly weakened and JPMorgan Chase & Co. (JPM) looks especially vulnerable.
Not all the technical readings are uniformly negative because while the daily studies on Wells Fargo & Company (WFC) are negative, the weekly OBV, which typically tops out ahead of prices, is still positive.
The break of support in Citigroup Inc. (C) does increase the pressure on the downside with key support at the June lows.
In reaction to weak earnings, these banks could see a drop of 3-5%, so ahead of earnings, one needs to decide whether to reduce their exposure in the big banks. Clearly a resolution of the political stalemate would be a positive.
How to Profit: No new recommendation
Portfolio Update: Last month, I recommended buying Morgan Stanley (MS) on a pullback as it had made a significant new high with positive readings from the weekly studies. The volume in MS has increased on the decline with monthly pivot support now at $25.43.
Should be 50% long Morgan Stanley (MS) at $27.81 and 50% long at $27.25, raise the stop now to $26.17. On a move above $27.12, raise the stop to $26.44.


