With just three more days left in the third quarter, Moneyshow’s Tom Aspray demonstrates how the quarterly pivots kept you on the right side of the market in the third quarter and what levels you should be watching to stay on track for the rest of the year.
Stocks had another feeble rally attempt on Wednesday but closed weak, and while Durable Goods were better than expected, prior months were revised downward. New Home sales were better than expected, but the focus seemed to be on the budget crisis in Washington.
On today’s calendar, in addition to jobless claims, we get the final reading on second quarter GDP, Pending Home Sales. Technically, the major averages, like the Spyder Trust (SPY) and PowerShares QQQ Trust (QQQ), need to close above Tuesday’s high to reverse the downside momentum. The futures are a bit higher in early trading.
The relationship of a market to its quarterly pivot line (The Most Powerful Pivot Level) can be used to determine a market’s dominant trend. As we end the third quarter, the pivot levels should be watched closely to see how these four key markets are likely to act in the last quarter of the year.
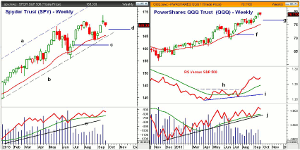
Chart Analysis: The weekly chart of the Spyder Trust (SPY) shows a wide range, but a small difference, between the open and close last week, suggesting an indecisive market.
- The SPY started the year off on a positive by gapping above the first quarter pivot at $142.64, which was a positive sign for stocks in 2013.
- The SPY opened the second quarter at $156.59, which well above the second quarter pivot at $152.65.
- During the third quarter, the SPY closed below the quarterly pivot at $161.33, line c, for two days in early July, before prices turned sharply higher.
- Based on current data, the preliminary value for the fourth quarter pivot is at $167.78, line d.
- The rising 20-week EMA held up well on the recent decline and is now at $165.35.
- The weekly OBV did confirm the recent highs and is well above its WMA.
- The fourth quarter S1 support is tentatively at $161.96 with the R1 resistance at 175.34.
The PowerShares QQQ Trust (QQQ) has been much stronger than the SPY in the third quarter, as it is up 10.2% versus just 5.4% for the SPY.
- The QQQ started off the year in a similar fashion as the SPY, based on the quarterly pivot analysis.
- In the second quarter, the pivot at $67.85 was broken on a daily closing basis twice in April, but not on a weekly basis. I have found weekly closes to be more important.
- The QQQ has stayed above its pivot at $71.18, line f, for the entire third quarter.
- The QQQ slightly exceeded its third quarter R2 resistance at $79.25 last week.
- The relative performance completed its bottom formation, line i, in late July as it moved through the resistance, at line h.
- The weekly OBV tested its uptrend, line j, in August, and made new highs last week.
- Based on current data, the fourth quarterly pivot would be at $76.62, line g, with the S1 at $73.56 and the R1 at $81.89.
NEXT PAGE: Two Key Markets to Watch
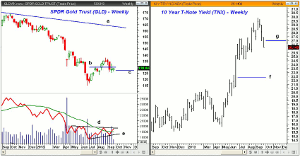
|pagebreak|The SPDR Gold Trust (GLD) is currently down 25.3% for the year, as it opened 2013 trading below its first quarter pivot at $165.21.
- GLD stayed below its second quarter pivot at $156.64 for the entire quarter.
- The third quarter pivot at $129.89, line b, stalled the rally on July 23, as GLD closed just below it at $129.71.
- On August 15, the third quarter pivot was decisively overcome, as GLD closed at $132.58.
- GLD is now trading below its quarterly pivot, and based on the current data, the fourth quarter pivot will be at $127.31.
- The weekly OBV is above its WMA and shows a slight uptrend, line e.
- The OBV needs a close above the resistance, at line d, to complete the bottom formation.
- The fourth quarter R1 is at $137.89 with the S1 support at $117.08.
The bond market has been the focus of many investors this year and the yield on the 10-Year T-Note (TNX) opened the year above its quarterly pivot at 1.752%, (17.52 on the chart).
- The yield started the second quarter at 1.840%, which was below the second quarter pivot at 1.910%.
- The second quarter pivot was overcome with the weekly close at 1.949% on May 17.
- The yield opened the third quarter at 2.521%, which was well above the pivot at 2.237%, line f.
- Yields have declined sharply over the past few weeks, as the reaction to the FOMC, I believe, changed the trend for bonds.
- The current yield at 2.614% is well below the preliminary fourth quarter pivot at 2.696%.
- The S1 quarterly support is at 2.408% with the R1 resistance at 2.941%.
What it Means: In August, I reviewed the quarterly pivot analysis on many of the key ETFs, as their rallies appeared to have stalled at key quarterly levels.
It will be important to see how these ETFs open the fourth quarter, in relation to their fourth quarter pivots, and I will publish a full list next week.
How to Profit: No new recommendation.


