
Many were recently surprised when homebuilder and construction company stocks showed both earnings and revenue gains, so now MoneyShow’s Tom Aspray shows you what to pay the most attention to before your next homebuilder play.
Stocks had another choppy session Tuesday, but the major averages demonstrated their resilience again as they closed the day well above the worst levels. The Nasdaq Composite managed slight gains, while the Dow Jones Home Construction Index lost 1.8%.
The ISM Non-Manufacturing Index was stronger than expected on Tuesday, and today the economic focus will be on the Leading Indicators. Of course, in terms of market sentiment, most are wondering how the Twitter IPO will turn out on Thursday.
The technical action for the Powershares QQQ Trust (QQQ) and Spyder Trust (SPY) is positive, while McClellan oscillator on the NYSE Composite has declined further to -56. This allows for a further correction over the near term, though the futures are showing nice gains in early trading Wednesday.
As the earnings season winds down, many have been surprised by the strength in the homebuilding and construction company stocks. Both earnings and revenues showed nice gains of 31.6% and 21.2% respectively, according to Zacks Equity Research.
The NAHB reported last month that their Housing Market Index declined slightly in October to 55. Technically, this Index gave a strong buy signal in early 2012 when investor sentiment on the homebuilding stocks was still quite negative. It was below 10 in 2009, so a pullback is not surprising.
But what about the technical outlook for the homebuilding stocks and leading ETFs? The homebuilder stocks completed their bottom formations in October 2011 when they broke out on strong volume. After showing impressive gains for the prior twenty months, these stocks peaked in May of 2012 and corrected into the summer lows. Does the technical outlook favor buying the homebuilders now?
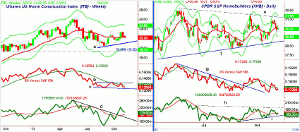
Click to Enlarge
Chart Analysis: The iShares US Homebuilders (ITB) is the closest to a pure homebuilder play with 9% each in PulteGroup (PHM), Lennar Corp. (LEN) and DH Horton (DHI). The weekly chart suggested an important low might be forming in August.
- The rally was not as strong as expected, though the higher low, line a, is still intact.
- The 20-week EMA is now being tested, along with the quarterly pivot at $22.21.
- There is more important support in the $21 area, which is the November projected pivot support.
- The weekly relative performance has dropped below its WMA, but is still in a trading range, lines b and c.
- A move in the RS line above resistance, line b, will indicate that it is again a market leading sector.
- The on-balance volume (OBV) moved through its downtrend in early October.
- The OBV has turned lower but is still above its WMA.
- There is key weekly resistance now at $23.76-$23.86.
SPDR S&P Homebuilders (XHB) has 44% in mid-caps and 43% in small-caps, with homebuilders making up just over 30% of the ETF. The rest is allotted to building product and home furnishing stocks.
- The daily chart shows a broad trading range, lines e and f, with XHB just below its 20-day EMA.
- It has closed above the quarterly pivot at $30.72 for the past two weeks.
- There is initial resistance at $41.40 and then at $32 with the quarterly R1 at $32.54.
- The daily relative performance broke its downtrend, line g, in September, which was a positive sign.
- The RS line retested the lows last month, and a move above the September highs is needed to signal it is a market leader.
- The OBV still shows higher lows, line I, but needs to move through resistance at line h, to complete a bottom.
- The daily starc- band is at $28.68 with the September low at $28.39.
NEXT PAGE: Two Homebuilders Exceeding Expectations
|pagebreak|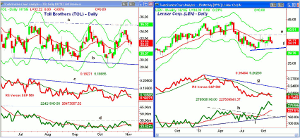
Click to Enlarge
Toll Brothers (TOL) reported sharply higher earnings in September with a third quarter EPS of $0.26, compared to $0.12 in the second quarter. The daily chart shows a broad trading range, lines a and b, that goes back to July.
- The recent high at $34.13 is first resistance, with further at $35.02-$35.26.
- The relative performance formed slightly lower lows in October and is now back below its WMA.
- The RS line needs to surpass resistance at line c, to indicate it is a market leader.
- The OBV is also below its WMA and needs to move strongly above resistance at line d, to turn positive.
- The close Tuesday was below the quarterly pivot at $32.54, with the daily starc- band at $30.97.
- The major support is at $29.64, and stops would need to be placed below this level.
Lennar Corp. (LEN) also exceeded its earnings expectations, as revenue was up 46% on a year-over-year basis with EPS up 35%. Still, the stock is trading just barely above the level when the earnings were released.
- The weekly chart shows that rallies since July have failed at the resistance, line e, in the $37.87 area, which corresponds to the 50% Fibonacci resistance at $37.66.
- LEN is currently below the 20-week EMA at $35.37, with the quarterly pivot at $34.83.
- In October, LEN had a low of $2.66, with further support, line f, at $31.63.
- The weekly relative performance formed a negative divergence at the highs, line g.
- The RS line is back below its WMA and the prior lows.
- The weekly OBV is acting much stronger, as it broke through resistance, line h, at the end of September.
- The OBV subsequently moved well above the May highs and is leading prices higher.
- The daily OBV (not shown) is below its WMA, so the multiple time frame OBV analysis is mixed.
What it Means: As a technical analyst, I have seen many examples where the technical signals led the fundamental data like the earnings. Even though the homebuilders have had strong earnings over the last two quarters, most made their price highs in May.
The rally in September suggested they had bottomed and new longs were recommended on a pullback, but the long positions were stopped out on the early October drop. This clearly weakened the technical outlook and makes me currently more cautious about this industry group.
My long term trend analysis for the homebuilders is positive, but only Lennar Corp. (LEN), with its very strong weekly OBV, is the only one I would look to buy at lower levels. The others need to complete their daily bottom formations before they are bought.
How to Profit: For Lennar Corp. (LEN), go 50% long at $33.14 and 50% at $32.44, with a stop at $31.39 (risk of approx. 4.3%).
Editor’s Note: If you’d like to learn more about technical analysis, attend Tom Aspray’s workshop at The Trader’s Expo Las Vegas, November 20-23, 2013. You can sign up here, it’s free.


