MoneyShow’s Tom Aspray takes a technical look at three mid-year picks of investment strategist Abby Joseph Cohen, and demonstrates why it doesn’t make sense to have buy and hold recommendations for a fixed time period.
The mixed close in the major averages was not what the market needed to signal upward acceleration, as declining stocks led the advancing ones. The oil service stocks were hit the hardest, as the Philadelphia Oil Service Sector Index lost over 2%.
Many of the daily technical studies that turned higher last week have turned lower, after failing to make new highs with prices last week. A close below last week’s lows in the Spyder Trust (SPY) at $177.98 is likely to trigger some heavier selling. It will be important to watch the market internals if stocks do drop further, as stronger sell signals could be generated.
Most of you are likely familiar with Barron’s long standing Roundtable Panels, which are featured at the start and mid-way through the year. Stocks that are mentioned in the articles generally move higher initially, but how do they do in the next six months?
In today’s column, I would like to take a technical look at the three mid-year picks of Abby Joseph Cohen (page 7), a well-known investment strategist from Goldman Sachs. At the start of the year, she was also bullish on stocks and skeptical on bonds. But first, let’s look at the current market.
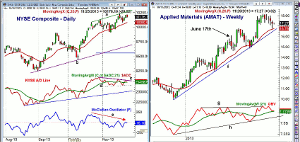
Chart Analysis: The NYSE Composite made a new daily closing line last Friday at 10,205, with a new intra-day high Monday at 10,212.
- The rising 20-day EMA is at 10,080, with last week’s low at 10,072.
- There is monthly projected pivot support at 9981 and chart support at 9909.
- The longer term uptrend for the NYSE is now at 9672, with the quarterly pivot, (blue line), at 9558.
- The NYSE Advance/Decline peaked on October 29, and failed to make a new high two weeks ago.
- Another divergence, line c, was formed last Friday, and a break of support, at line d, would confirm the divergence and generate a daily sell signal.
- The McClellan oscillator also shows multiple divergences, (see arrow), after peaking in October.
- The oscillator had a high of +38 on November 15, but was just +6 last Friday.
- There is resistance now at the prior highs and then at 10,389 the quarterly R2 resistance.
Applied Materials (AMAT) was trading at $15.25 when it was recommended, and peaked that week at $16.09.
- AMAT declined to a low of $14.62 the following week, before turning higher.
- The weekly chart shows a well-defined pattern of higher highs and higher lows.
- The October high was $18.18, and last week it tested the 20-week EMA.
- So far, it has held above the quarterly pivot at $16.69.
- A weekly close below this level will suggest a drop to the major 38.2% Fibonacci retracement support at $15.04.
- The weekly OBV moved back above its WMA in September, but just made marginal new highs in October.
- There is first resistance at the weekly low in the $17.32 area.
NEXT PAGE: Two More of Ms. Cohen’s Picks
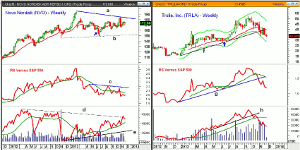
|pagebreak|Another pick of Ms. Cohen’s was Novo Nordisk (NVO), a Denmark-based $92.2 billion drug manufacturer. It was trading at $167.75 when recommended, and is currently just a bit higher.
- The stock made its high in February at $194.44 when a doji was formed.
- In 2013, it has formed a flag formation, lines a and b, with key resistance now in the $181.80-$183.83 area.
- If completed, the 127.2% Fibonacci flag targets are in the $207-$208 area.
- The measured target from the triangle formation is in the $220-$225 area.
- The relative performance spiked above its WMA in October, before reversing to the downside, and recently made new lows.
- The weekly on-balance volume (OBV) bottomed in June and shows a long-term base.
- It has consistently held above its WMA and has just barely moved above its downtrend, line d.
- A drop below the five week low at $165.18 would return the focus on the downside, with the June low at $149.49.
Trulia, Inc. (TRLA) was the last pick, as it is a $1.25 billion Internet provider of real estate information. It was trading at $29.35 when recommended.
- The chart shows that the timing was excellent, (see arrow), as it was one week after the low at $27.25.
- In just six weeks, TRLA was spiking above its starc+ band as it hit a high of $47.97.
- After a setback in August, it surged to another new high at $52.71 in September.
- This high also came very close to its starc+ band.
- Seven weeks after the high, the starc- band was tested as TRLA had a low of $33.43.
- It has made a new low at $33 this week, which is a drop of 37.4% from the highs.
- The relative performance dropped below its WMA four weeks after the highs, and then broke its uptrend, line g.
- The weekly OBV did confirm the recent highs before dropping below its uptrend, line h.
- The OBV is now well below its declining WMA.
What it Means: I always find it interesting to look back in time to analyze my own investment picks, as well as those of others. These three picks, in my opinion, illustrate that it is not reasonable to have buy and hold recommendations for a fixed time period like six months.
Within this framework, the interviewer could always ask when the analyst would sell, or what would make them change their opinion.
Trulia, Inc. (TRLA) was picked, in part, because, in the analyst’s opinion, it was selling at a discount to Zillow, Inc. (Z). I have to think that sometime before or after it was up almost 80%, that it was no longer trading at a discount. Technically, it should have been sold, at least, around $42-$43. Very few successful analysts can allow an 80% winner to turn and get back to breakeven.
The starc band analysis also did warn of the top in Trulia, Inc. (TRLA) and yesterday’s article pointed out some vulnerable S&P 500 stocks.
How to Profit: No new recommendation.


