Widely believed to be a leading indicator of future economic growth, MoneyShow’s Tom Aspray goes prospecting for buy candidates in this market-leading sector as he expects the economic recovery to pick up steam in the new year.
As expected before Tuesday’s open, stocks were hit hard Wednesday and a weekly close around current levels or lower will confirm the start of the long overdue market correction. The financial media is scrambling to find an excuse for Wednesday’s slide with “tapering” the top contender, so far.
Of course, the real reason is that since late November, fewer and fewer stocks have been pushing the market higher. This caused the formation of negative divergences in both the volume and the A/D indicators. These divergences have been now been confirmed.
The stock index futures are slightly lower in early trading while the losses are greater in the stock markets of Asia and Europe. There should be a rebound in the next week but it is likely to come when the markets, like the Spyder Trust (SPY), drops to or below its daily starc- band, which is currently at $177.49. I recommend sticking with long positions in the triple inverse ProShares UltraPro Short S&P 500 (SPXU) that was recommended by Tweet on Tuesday.
Tuesday’s low-close doji sell signals require a move above Monday’s highs to be reversed. A Friday close at current levels will also generate weekly LCD in the Spyder Trust (SPY) while the stronger PoweShares QQQ Trust (QQQ) needs a weekly close below $84.78 for it to generate an LCD sell signal.
The correction will ultimately create a good buying opportunity as I expect the economy to get even stronger in 2014 and validate the recent high stock prices. Therefore, I would expect the Dow Jones Transportation Average to continue to be a market leader. There are two transportation industry groups that look especially attractive on a pullback to good support.
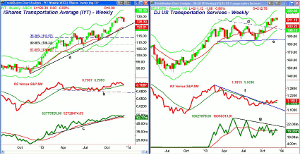
Chart Analysis: The iShares Transportation Average (IYT) is up 34.9% YTD this year and 7.2% in the past three months.
- IYT is currently below the prior two-week lows and a close at current levels ($126.30) would trigger a weekly low close doji sell signal.
- The monthly projected support is at $125.43 with the November lows at $123.74.
- The weekly uptrend and the 20-week EMA are in the $122 area.
- The major 38.2% Fibonacci retracement support is at $113.57.
- The weekly relative performance is now testing its WMA with major support at line b.
- The daily RS line (not shown) dropped below its WMA last week.
- The weekly OBV formed a very slight divergence at the highs and has broken its uptrend, line c.
- The daily OBV divergence was more pronounced and it is now negative.
The DJ Transportation Service includes stocks like Pacer International Inc. (PCAR) and XPO Logistics (XPO). Here is a full list from www.bigcharts.com.
- The weekly chart shows the completion of a flag formation, lines d and e, at the end of October.
- The weekly starc+ band is now at 222.60.
- The upside targets from the formation are in the 230 area, which is about 15% above current levels.
- The relative performance broke its downtrend, line f, before prices broke out to the upside.
- The RS analysis does suggest that the group is becoming a market-leading sector.
- The weekly OBV has not confirmed the upside breakout as it has formed lower highs but the volume data just starts in 2013.
- The rising 20-week EMA is at 203 with the former downtrend (line d) at 200.
NEXT PAGE: Tom’s Top Transport Picks
|pagebreak|The DJ US Delivery Services group includes well-known names like FedEx Corp. (FDX) and United Parcel Services (UPS) and it has gained over 39% so far in 2013.
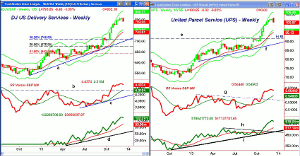
- The weekly starc+ bands were tested in November but the rally has stalled over the past three weeks.
- There is next support in the 769-773 area with the weekly starc- band at 753.83.
- The rising 20-week EMA is a bit lower at 743.91.
- The weekly relative performance broke through strong resistance, line b, at the end of October.
- The RS line is well above its WMA and support at line c.
- The on-balance volume (OBV) broke out to the upside last April and has since been in a very strong uptrend.
- The weekly OBV did confirm the highs but the daily (not shown) has dropped below its WMA.
United Parcel Services (UPS) is up just over 40% YTD, which is a bit worse than the 49.5% gain of its main rival FedEx Corp. (FDX). The weekly technical studies look stronger for UPS, which makes it my favorite.
- A close in UPS below the doji low of $101.19 will trigger an LCD sell signal with the projected monthly pivot support at $98.67.
- The weekly starc- band and rising 20-day EMA are at $96.38 and $95.13 respectively.
- The weekly breakout level, line e, is at $91.56.
- The relative performance moved through major resistance, line g, before the end of October.
- The RS line is well above its strongly rising WMA.
- The weekly OBV broke through its resistance, line h, at the same time and is acting very strong.
- The OBV is well above its rising WMA and the long-term uptrend, line i.
What It Means: In last week’s Portfolio's Pops & Drops, I recommended raising stops and taking profits in the Charts in Play portfolio stocks. As we head into 2014, I think it will be advantageous to have a decent level of cash, so that bargains can be picked up when the correction is over.
I will be making further adjustments in the coming week on my Twitter feed. I would look for a normal correction in United Parcel Services (UPS) to establish new long positions and will be watching stocks in the US Delivery Services group.
How to Profit: For United Parcel Services (UPS), go 50% long at $95.36 and 50% at $94.38, with a stop at $90.88 (risk of approx. 4.2%).
Portfolio Update: Should be long the ProShares UltraPro Short S&P 500 (SPXU) at $16.40 or better from Tuesday. I recommended a limit of $16.46, and for the hour after the Tweet, it traded between $16.40 and $16.32 as $16.40 was the day’s high.


