Since commodities such as crude and precious metals have been rallying recently, MoneyShow’s Tom Aspray wonders whether or not it’s time to start looking at resource-heavy stock markets such as Australia and Canada.
Another round of overnight selling was met with good buying on Thursday. The Durable Goods orders were not as weak as expected and that combined with supportive comments by the Fed’s
Janet Yellen put the bulls in charge.
The S&P 500 had a new all-time closing high but it may take a close above Monday’s high at 1858.71 to worry those who remain on the short side. The nervous bulls are now focused on the recent decline in rates, which suggests that the bond market is not convinced that the recent soft economic data is weather related as yields on the 10-year T-note continue to decline.
Crude oil has rallied impressively over the past seven weeks as the May contract hit a low of $91.39 in the middle of January and hit a high this week of $102.68. As I have been noting for the past month, the higher crude prices have not given the energy stocks much of a boost yet. Global inflation rates are also still quite low but I think stock investors should welcome a gradual increase in inflation.
Gold prices have been quite strong this year as the SPDR Gold Trust (GLD) is up about 10% in 2014 compared to just a 0.5% gain in the Spyder Trust (SPY). With crude and gold both strong, should investors be looking at the resource-heavy Australian and Canadian stock markets?
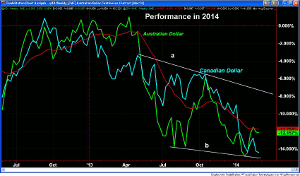
Chart Analysis: The Australian and Canadian dollars have performed much differently, so far, in 2014.
- The Australian dollar made its high in 2012 at over 1.08 and is currently trading just below 0.90.
- For the year, it is down over 14.5% as many believe the resource- and construction-led boom in Australia is over.
- Most are not expecting the Australian Reserve Bank to hike rates this year, and some think the Aussie dollar could drop to the 0.66 level.
- Technically, the A$ is in a clear downtrend with major resistance in the 0.95-0.98 area.
- The Canadian dollar in 2014 has risen from about 1.06 to over 1.11.
- This is a gain of roughly 12.7% as many seem to be convinced that their economy will show growth of 2.3% in 2014.
- The economy disappointed many in 2013, and while some are looking for a rate cut by the Bank of Canada, others would not be surprised by higher rates.
- The growth in Canada is obviously dependent on US growth.
- The C$ has first weekly support at 1.0900 and it is well above the quarterly pivot at 1.0541.
- A weekly close above 1.1200 would be very bullish for the C$.
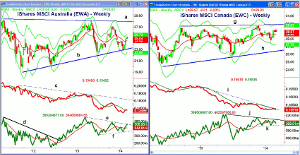
The iShares MSCI Australia Index (EWA) is up 2.7%, so far in 2014, but was down 1.2% in 2013. This does not compare well with the 25.7% gain in the Spyder Trust (SPY).
- EWA has an expense ratio of 0.53% and has 81 holdings with 61% in the top ten stocks.
- The chart shows that the uptrend from the late 2011 lows, line b, was tested during the first week of February.
- The quarterly projected pivot support at $22.61 was also reached and a HCD buy signal was triggered.
- The weekly starc+ band is at $25.72 with additional resistance at $26.63 and then at $28, line a.
- A weekly close above this level would break EWA out of its year-long trading range.
- The relative performance has formed a pattern of lower highs, line c, as EWA has been weaker than the S&P 500.
- The RS also shows a pattern of lower lows.
- The weekly OBV broke its downtrend, line d, in 2012 prior to the nice rally into the early-2013 highs.
- The OBV has formed higher lows, line f, and is now testing its downtrend, line e.
- The OBV is acting stronger than prices but the daily OBV (not shown) is not as impressive.
- There is minor support now at $24.53 and the 20-day EMA with monthly projected pivot support at $23.31.
NEXT PAGE: A Global ETF to Watch
|pagebreak|The iShares MSCI Canada (EWC) is down 0.48% in 2014 with a one-year performance of 5.16%. It last had a double-digit gain in 2010 when it was up 19.8%.
- EWC has an expense ratio of 0.51% with a total of 91 holdings and just over 40% in the ten largest holdings.
- The weekly chart shows a broad trading range, lines g and h, that goes back to 2012.
- EWC dropped to test its starc- band in early February at $27.21.
- The major resistance is in the $29.80-$30 area, line g, and the weekly starc+ band.
- There is minor support at $28.83 and the 20-week EMA with the quarterly pivot a bit lower at $28.67.
- The monthly projected pivot support stands at $27.71.
- The weekly relative performance indicates that EWC is still lagging the S&P 500.
- The RS line just tested its declining WMA and resistance at line i.
- The weekly on-balance volume (OBV) held above support, line k, on the recent decline, which is a good sign.
- The OBV looks ready to drop below its WMA this week but the daily OBV (not shown) does look better.
What It Means: The Select Sector SPDR Materials (XLB) broke out to the upside, Thursday, which was expected given the strong technical readings after Wednesday’s close. This should eventually be a positive for both the Australian and Canadian stock markets.
Currently, neither of these ETFs looks strong enough technically to buy, and there are no clear signs of an imminent upside breakout.
I will continue to watch these markets, but I still prefer the Eurozone where the evidence of an economic turnaround is stronger.
How to Profit: No new recommendation.


