
Given the quiescent nature of inflation even after the Fed's massive and unprecedented stimulus, MoneyShow's Tom Aspray explores whether this bugbear is about to stage a comeback, and if so, what market participants should expect to happen next.
Even though it was a short week for the markets, the bulls got their money's worth as even a sharp drop in Japan's Nikkei 225 last Thursday could not keep the US market down as stocks dropped early before finishing the day higher.
There was plenty of economic news to placate both the bulls and bears, both of which seem to be frustrated by the recent wide swings. One data point that caught my eye was the normally boring CPI report.
Late last year, I felt that the threat of deflation might keep the Fed from tapering, and I still think that deflation is still the greater threat, The low inflation rates in the Eurozone have been a key factor in the ECB's decision to keep rates low.
With January's data, the overall CPI inflation rate on a year-to-year basis came in at 1.6%, which was the highest rate since early 2013. So what does this mean for stocks?
Those who have been bearish on the stock market since the dot.com days often point to an inflation-adjusted or constant-dollar chart of the US stock market to support their negative outlook.
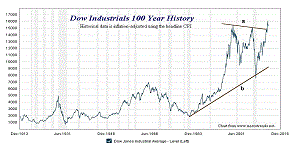
Click to Enlarge
This 100-year chart of the Dow Industrials from Macrotrends has the historical data adjusted for inflation using the headline CPI. The chart shows that even the adjusted Dow Industrials chart has broken out to the upside as the resistance that connects the 2001 and 2007 highs (line a) has been overcome. This is bullish and cancels out the break of the uptrend in 2008, line b, that went back to the 1983 lows.
The massive stimulus during the financial crisis was thought by most (myself included) to eventually cause significant inflation. As this has not yet occurred, many have changed their minds, and this could have helped to push gold prices sharply lower last year.
Much higher inflation is still possible down the road, and in my experience, major changes in the financial markets often take much longer than most expect.
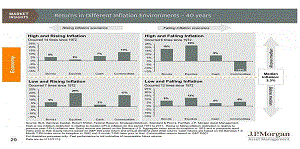
Click to Enlarge
This table from J.P. Morgan provides the most comprehensive graphical view of what has happened historically during different inflation environments. Since 1972, we have seen an environment of low and rising inflation seven times (lower left) and this has led to a 20% gain for stocks. This was also a good period for commodities, which were up 17%.
The other best environment for stocks is when there is high and falling inflation. This has only happened six times since 1972 and during these periods stocks have been up 23%, closely followed by a 18% gain in bonds.
This analysis strongly suggests that stock investors should welcome a gradual increase in the inflation rate over the next few years.
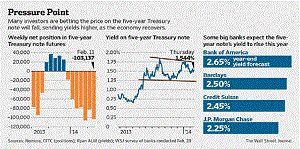
Click to Enlarge
Investors are still focused on rates and last Friday's article in the Wall Street Journal pointed out that there is a very heavy short position now in the five-year Treasury notes. This means that they are expecting the notes to fall and for rates to move higher.
All four of the big banks are looking for rates to move significantly higher in 2014 with Bank of America's target at 2.65%, which is up from the current level of 1.54%. The daily chart of the five-year Treasury notes shows what I view as a flag or continuation pattern similar to what is also evident on the chart of the 10-year T-note yields.
I have found this type of formation to be one of the most reliable, and it was the focus of last week's trading lesson. A move in the five-year T-note yield above 1.80% will project a rise to 2.30%. Of course, yields can stay within this range for some time before breaking out.
NEXT PAGE: What to Watch
|pagebreak|Now that the earnings seasons has pretty much ended, investors can relax a bit more. In my view, this earnings season was one of the worst as there seemed to be many more 10-20% moves in stocks after their earnings were released.
According to Bespoke Investment Group's review of the earnings season “61.9% of US companies beat consensus analyst earnings estimates and 63.8% beat on top line revenue.” These were some of the best numbers since 2011.
The data on the housing sector last week was quite disappointing as the Housing Market Index dropped 10 points to the lowest reading since last May and housing starts plunged 16%. The housing stocks reacted pretty well to the weak data as the iShares Dow Jones US Home Construction ETF (ITB) was higher on the week.
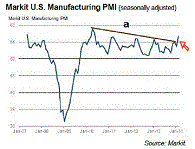
Click to Enlarge
On the positive side, the Markit US Manufacturing Index came in much better than expected at 56.7. The chart shows that the pattern of lower highs, line a, has been overcome. This was the sharpest improvement since 2010, and as reported by Markit, was due to “accelerated increases in production levels and incoming new work in February.”
This week, we get the Chicago Fed National Activity Index, the PMI Services Index, and the Dallas Manufacturing Survey on Monday. This is followed by the S&P/Case-Shiller Housing Price Index and Consumer Confidence on Tuesday.
The New Home Sales are likely to be weak on Wednesday and more will be watching the Durable Goods on Thursday. The week finishes with the preliminary reading on 4th quarter GDP, the Chicago PMI, Consumer Sentiment from the University of Michigan, and the Pending Home Sales Index.
What to Watch
The stock market bears did not get much relief last week but the bulls still had to be very cautious buyers. There seemed to be a loss of upside momentum late in the week, which may mean we will get a pullback this week.
As I noted earlier, there is plenty of economic data out this week that could help to discourage new buying. The inability of the Spyder Trust (SPY) to make new highs with the PowerShares QQQ Trust (QQQ) is making some bulls nervous, and it would not take much to trigger some selling.
There are clearly some market-leading sectors like technology, which some will looked at for new opportunities. There are also some industry groups that are acting weaker than the S&P 500 and should be avoided.
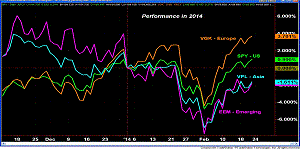
Click to Enlarge
The markets have been tough, so far in 2014, and this is evident by the performance chart of the European, US, Asian, and emerging markets. The Vanguard FTSE European ETF (VGK) was up 2.79% in early January, then dropped to a loss of 4% by the end of the month. It is the current leader now, up 3.7%.
The US market, as represented by the Spyder Trust (SPY), has improved sharply from its lows and is now up about 1.0%. The iShares MSCI Emerging Market (EEM) was the weakest as it was down 7.8% at the February lows versus a 7.1% loss in the Vanguard FTSE Pacific ETF (VPL). VPL has a large holding in Japan.
Both of these laggards have also improved but are still down for the year. If we get a sharper pullback, it will be interesting to see how they perform as my long-term outlook for Japan is positive.
The sentiment has unfortunately gotten a bit more bullish as the number of bullish individual investors, according to the AAII survey, has risen from 40.15% to 42.22%. The % of bears saw an even larger change as it is down to 22.78% from 27.34% the previous week.
The five-day MA of the number of S&P 500 stocks above their 50-day MAs rose to 58.3%, Thursday, after dropping down to 30% just a few weeks ago.
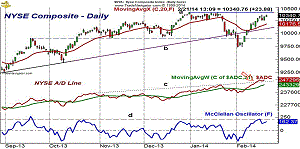
Click to Enlarge
The market internals were very strong last week even though the daily chart of the NYSE Composite shows that it is still well below the January highs, line a. There is first support now at 10,176 and the rising 20-day EMA, and then in the 9900-10,000 area. The February low of 9738 is now a more important level of support.
As noted last week, the most bullish development was the convincing new highs in the weekly NYSE Advance/Decline (not shown). The daily A/D line also made further new highs last week after breaking through its trendline resistance at line c. It is well above its rising WMA, and typically, a pullback to its WMA will be a good buying opportunity. It would take a drop below the February lows to weaken the outlook.
The McClellan oscillator hit a high of +216 last week, which is moderately overbought (line d). It does show a short-term loss of momentum that could also be a sign of a pullback.
NEXT PAGE: Stocks
|pagebreak|S&P 500
The rally in the Spyder Trust (SPY) appears to have stalled at the previous all-time highs and a drop now below last Thursday's low at $182.60 should bring out the bears. The 20-day EMA is clearly rising at $181.63 with further support at $179.86 and the daily starc- band. The daily starc+ band is now at $187.65 with the weekly at $188.47.
The daily on-balance volume (OBV) has rallied up to its downtrend, line c, and needs a strong close, Monday, to break out to the upside. The weekly OBV (not shown) is positive as it is well above its WMA.
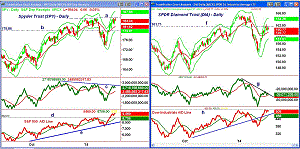
Click to Enlarge
The S&P 500 A/D line made a marginal new high last week and is well above the previous highs from the December-January period, line d. The A/D line is also above its WMA, which is in a solid uptrend.
Dow Industrials
The SPDR Dow Industrials (DIA) has rallied back to the resistance in the $161.71 area, line f, but has not been able to overcome it. The relative performance analysis (not shown) still indicates this is not a market-leading sector. The monthly projected pivot resistance is at $162.74 with the daily starc+ band now at $164.35.
The daily OBV closed just below its steep downtrend, line g, as it attempted to move above it last Tuesday.
The Dow Industrials A/D line has tested the early 2014 highs at line h but has not been able to break out to the upside.
Click to Enlarge
Nasdaq-100
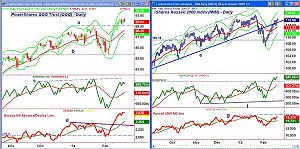
The PowerShares QQQ Trust (QQQ) made a new rally high last week but closed pretty much where it opened, thus forming a doji. Therefore, a weekly close under $89.31 would trigger a low close doji sell signal.
The monthly projected pivot resistance at $90.82 has not been reached with the daily starc+ band at $92.02.
The chart has first support now at $89.00, which was the high from January with the rising 20-day EMA at $88.25. The daily starc- band is a bit lower at $87.25. The monthly pivot stands at $86.68 for February but should rise close to $88 in March.
The daily on-balance volume (OBV) moved further above its WMA but is still below the January highs and the resistance at line c. The weekly OBV (not shown) has made new highs and is acting stronger than prices.
This is also true of the Nasdaq 100 A/D line as it made further new highs last week and is still well above its rising WMA. There is additional support at the breakout level, line d.
Russell 2000
The iShares Russell 2000 Index (IWM) closed near the highs for the week as it has reached the strong resistance in the $115.50-$116 area. The prior highs are at $117.37 with the daily starc+ band at $118.08.
There is first support at $113.33 and the 20-day EMA, which is now clearly rising. There is stronger support at $111.35 and the daily starc- band.
The daily OBV is still acting strong after breaking out to a new high the previous week. It is well above its rising WMA. The weekly OBV (not shown) does look more negative as it has just rallied back to its flattening WMA. A higher close is needed this week to turn it positive.
The daily Russell 2000 A/D line continues to lag as it is still well below its previous peaks and the resistance at line g.
NEXT PAGE: Sector Focus, Commodities, and Tom's Outlook
|pagebreak|Sector Focus
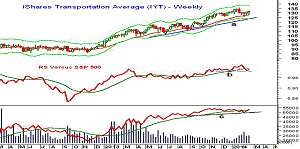
The iShares Dow Jones Transportation (IYT) closed higher last week but is still down slightly for the year. This is an important ETF for the market. The rising 20-week EMA is at $127.45 with the quarterly pivot at $126.16. It is one of those ETFs that did not have a weekly close below its pivot.
There is stronger chart support at the uptrend, line a, and the weekly starc- band. There is next resistance at $132.35 and then at the January high of $135.93.
The relative performance did confirm the highs in January before dropping below its WMA. It has turned up and a move back above its WMA would be positive.
Click to Enlarge
The weekly OBV has moved above its WMA and has support now at line c. The daily OBV (not shown) has held up better and is also above its WMA.
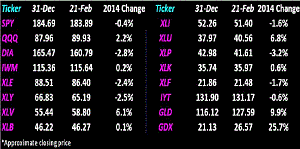
Now, half of the ETFs are up for the year as the leaders like the Select SPDR Health Care (XLV) and the Select SPDR Utilities (XLU) have added to their gains. XLY is up 7.1% while XLV is up well over 6%.
Of the market-tracking ETFs, the PowerShares QQQ Trust (QQQ) is still the leader, up over 2% for the year with the Select SPDR Technology (XLK) clearly in positive territory.
The Select SPDR Materials (XLB) is now higher for the year but there has not been similar improvement in the Select SPDR Industrials (XLI) as it is still down 1.5%.
Click to Enlarge
Though crude oil has been strong and natural gas is sharply higher, the Select SPDR Energy (XLE) is still down over 2% as is the Select SPDR Consumer Discretionary (XLY).
Crude Oil
Crude oil was strong last week as the May contract surpassed the resistance from last October and the early 2014 highs. The next upside target is at $104.56, which is the quarterly pivot resistance. Both the weekly and daily OBV are positive and do favor higher prices.
Precious Metals
The SPDR Gold Trust (GLD) and Market Vectors Gold Miners (GDX) did close the week higher as they marginally moved above the mid-week highs. In my review of the weekly and daily charts last week, I suggested that a pullback was likely over the near term. Another higher close this week will signal that stronger resistance level is going to be tested first.
The Week Ahead
The market is becoming split between those who think the S&P 500 will break out to the upside and move to significant new highs and those who are looking for another rally failure. The strong action of the market internals does favor an eventual upside breakout but that does not mean we can't see a pullback first.
This would be the best scenario for new investments as it should take the strongest stocks and ETFs back to their rising 20-day EMAs. This would make the risk on new positions more favorable. Those stocks that are just in the process of bottoming out should pull back to their recent lows, creating good entry points.
One still has to favor the technology and biotech sectors, which are the main components of the market-leading Nasdaq 100. I do expect the global economies to weather the current period of soft data and improve throughout the year. This should be bullish for both the material and industrial sectors, which I would be looking to buy on a pullback.
I also like Europe, and I adjusted my buy levels and updated my strategy on Japan last week.
For those who were not in the market in 2013, continue to follow the dollar cost averaging in an S&P 500-tracking ETF or mutual fund that I recommended in the January 24 column A Path to Investing Success in 2014.
Don't forget to read Tom's latest Trading Lesson, My Favorite Chart Patterns.


