
After a rough January and a choppy first week in February, MoneyShow’s Tom Aspray demonstrates how you can use quarterly pivots to determine whether you should be buying or selling in the current environment.
The strong market rebound late last week helped to dampen the high level of investor fear that was evident at the start of the week. If we get further gains early in the week, it is likely that even more traders will be squeezed out of their short positions. By several measures, the market is now much less overbought than it was just a few weeks ago.
In analyzing the market, the weekly and monthly closing prices can help one avoid the noise from the wide daily fluctuations. During last fall’s market decline in reaction to the government shutdown, I suggested that investors Avoid the Noise, Watch the Numbers.
It was my view that by focusing on the quarterly pivot levels, investors and traders would have a more objective way to determine whether they should be buying or selling. Therefore, I found last week’s action in the Spyder Trust (SPY) quite interesting as it traded below the quarterly pivot at $177.97 over the past two weeks but did not have a weekly close below it.
Click to Enlarge
For example, last week the SPY had a low of $173.71 but then rallied to close the week at $179.68, which was well above its pivot. If the market correction is actually over, the ability of SPY to hold above its quarterly pivot on a weekly closing basis will reinforce the value of quarterly pivot point analysis as a technical tool.
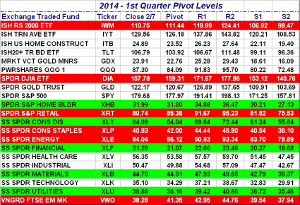
The updated table reviews the current status of the ETFs I normally track and those highlighted in red are the ones that closed the last week below their quarterly pivot levels. Those ETFs that are highlighted in green had closed below their weekly pivots since the start of the year but closed last Friday back above their pivots.
Those ETFs that are not highlighted, like the iShares Dow Transportation (IYT), have been able to hold above their quarterly pivots on a weekly closing basis so far in 2014. Let’s look at some of strongest and weakest ETFs.
Click to Enlarge
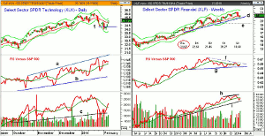
Chart Analysis: The Select Sector SPDR Technology (XLK) dropped last Monday below the quarterly pivot at $34.29 (line 1) as it hit a low of $33.92.
- The rebound pushed the XLK back above its 20-day EMA with further resistance at $35.63 to $36.05.
- The weekly starc + band is now at $36.80, which is very close to the monthly projected pivot resistance at $36.88.
- The daily relative performance shows a pattern of higher highs, line a, and has rebounded back above its WMA.
- The weekly RS line is in a gradual uptrend after bottoming last summer.
- The daily OBV did make new highs in January before dropping to support at line c.
- The OBV closed the week back above its WMA.
- The weekly OBV (not shown) has turned higher after holding well above its rising WMA.
- There is short term support now in the $34.35-$34.65 area.
The Select Sector SPDR Financial (XLF) peaked at $22.16 on January 15. At last Monday’s low of $20.50, it was down 7.5% for its high but closed the week down just 2.6% for the year.
- The weekly uptrend, line d, and the quarterly pivot at $21.07 were both broken last week.
- The weekly starc- band was tested and it is at $20.47 this week.
- The relative performance peaked last summer and has been diverging from prices, line f.
- It is a positive sign that the RS line is holding above the support at line g.
- The weekly on-balance volume (OBV) did confirm the price highs in early January, line h, before turning lower.
- The OBV has turned up and is very close to triggering an AOT buy signal.
- There is short-term support now in the $20.8-$21 area.
NEXT PAGE: 2 ETFs to Watch
|pagebreak|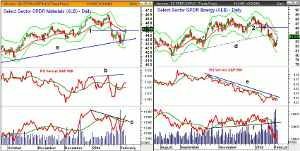
Click to Enlarge
The Select Sector SPDR Materials (XLB) closed on Friday, January 24, at $43.87, which was well below the quarterly pivot of $44.51 (line 1).
- The low last week at $42.78 was just below the quarterly S1 support at $42.79.
- The starc- band this week is now at $42.55.
- XLB rebounded to close 4% above the lows and back above the quarterly pivot.
- The daily relative performance did confirm the recent highs, line b, before dropping sharply.
- The weekly RS line (not shown) did close the week back above its WMA.
- The daily OBV formed a negative divergence, line c, at the recent highs.
- The daily OBV is now back above its WMA while the weekly (not shown) is close to making new highs.
- There is next resistance in the $45-$46 area and the daily starc+ band.
The Select Sector SPDR Energy (XLE) closed on January 24 at $84.33, which was well below the quarterly pivot at $86.12 (line 2).
- This close was also below the daily support at line d.
- The low last week at $81.78 was well below the quarterly S1 support at $83.70.
- There is next support at the October low of $81.31.
- The relative performance has been in a solid downtrend since October, line e.
- The RS line is still below its WMA.
- The daily OBV confirmed the pivot analysis by breaking below the support at line f.
- The weekly OBV (not shown) did form a negative divergence at the highs.
- It has turned up but it is well below its flat WMA.
- There is further resistance for XLE at the monthly pivot of $84.44 and then in the $86-$87 area.
What It Means: Many of the weakest sector ETFs in 2014 (see table), like the Select Sector SPDR Consumer Discretionary (XLY) closed below their quarterly pivots on the week ending Friday 24.
Of the ETFs that closed the week back above their pivots last Friday, the Select Sector SPDR Materials (XLB) and Select Sector SPDR Financials (XLF) look the most interesting on a pullback towards the recent lows.
How to Profit: For Select Sector SPDR Materials (XLB), go 50% at $43.88 and 50% at $42.94, with a stop at $41.47 (risk of approx. 4.5%).
For Select Sector SPDR Financials (XLF), go 50% at $20.96 and 50% at $20.66, with a stop at $19.77 (risk of approx. 5%).
Portfolio Update: For the Select Sector SPDR Technology (XLK), should be long at $31.58 with a stop at $33.29.
Editor’s Note: If you’d like to learn more about technical analysis, attend Tom Aspray’s workshop at The Trader’s Expo New York, February 16-18, 2014. You can sign up here, it’s free.


