Copper has always served as a bellwether for the health of the global economy, but with its widespread use as loan collateral by Chinese companies, MoneyShow’s Tom Aspray examines whether its traditional role still holds true.
The strong rally in global stock markets was not a surprise after last Thursday’s 2.42 reading in the Arms Index .It signaled that the market was oversold on a short-term basis. The Dow Industrials led the S&P 500 while the oil service and semiconductor stocks were the strongest.
The market internals were pretty strong on Monday but another equally strong up day is needed to turn the short-term momentum positive. A weak rally with minimal price gains will make the market more vulnerable as we head into the end of the week.
Copper prices have dropped sharply in the past month as they have violated the 2013 lows. Some feel that copper prices are a good measure of the global economy but I see it as more of a short-term reading on China’s economy. For signals on the US economy, I prefer the readings from the Leading Economic Indicator (see chart), which I think has a much better long-term record. We get the latest reading on the LEI on Thursday.
Looking at the technical and seasonal outlook for copper and two key copper stocks can give us an idea of how much lower copper prices might go.
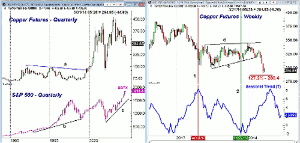
Chart Analysis: The quarterly charts of copper futures and the S&P 500 go back to 1983.
- From the 1988 high, copper prices formed lower highs until September 2005 when the downtrend, line a, was finally overcome.
- In contrast, the chart of the S&P 500 shows a long-term uptrend, line b, that was tested in 2002.
- From its high, the S&P 500 dropped 50% into the December 2002 low.
- During the same period, copper prices dropped 26.8% and the chart shows that prices were in a narrow range.
- Copper prices peaked in the first quarter of 2011 at 464.95 and are currently down over 36% from this high.
- The quarterly support will be broken at the end of March.
- The S&P 500 still shows a strong uptrend, line c, which is currently in the 1488 area.
The weekly chart shows the completion of a flag or continuation pattern in copper futures at the end of February as support at line e, was violated.
- The 127.2% Fibonacci retracement target from the flag formation is at 285.50.
- The chart formation has downside targets in the 273-275 area.
- For the next quarter, the pivot will be in the 309.50 area with the quarterly projected pivot support at 257.85.
- Copper has a seasonal tendency to peak on April 19.
- Copper typically then declines to form a seasonal low on November 22.
- There is strong weekly resistance now in the 300-305 area.
- The weekly OBV (not shown) dropped below its WMA last October and made new lows last week.
NEXT PAGE: 2 Key Copper Stocks to Watch
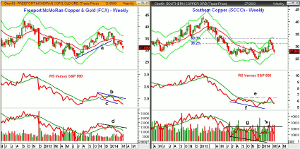
|pagebreak|Freeport-McMoRan Copper & Gold (FCX) broke its uptrend, line a, with its sharply lower close in the latter part of January.
- The lower weekly starc- band is now at $29.22.
- FCX peaked 11 weeks ago at $38.09, and as of Monday’s close, was down 17.3% from this high.
- In April of 2013, FCX had a low of $25.57.
- The weekly relative performance diverged from prices, line b, at the recent highs.
- The RS line shows a pattern of lower lows, line c, and is acting weaker than prices.
- The OBV also formed a negative divergence, line d, at the recent highs.
- The weekly OBV dropped below its WMA on January 24 and is close to its previous lows.
- There is initial resistance now at $32.20-$32.60 with stronger above $34.
Southern Copper (SCCO) is a $23.04 billion copper company that mines, explores, and smelts copper as well as other minerals in Peru, Mexico, and Chile. They recently reported an 11% decline in revenues compared to the previous year.
- In the middle of February, SCCO hit a high of $32.73 as the rally stalled between the 38.2% and 50% Fibonacci retracement resistance from the early-2013 high.
- This action is quite typical of a failing rally as the weekly starc+ band was tested in January.
- SCCO is now trying to hold the quarterly pivot at $27.50 as it is testing the daily starc- band.
- The weekly starc- band at $26.80 is not far below current levels.
- The relative performance has dropped below its WMA and has formed lower lows.
- The RS line needs to move above the resistance at line e to signal it is a market leader.
- The weekly OBV broke slightly above the resistance, line g, last month (see arrow) and it did make a new low in December.
- The weekly OBV is below its WMA as is the daily (not shown) so the multiple time frame OBV analysis is negative.
- There is minor resistance at $28.50-$29.
What It Means: Like the majority of futures markets, copper is quite volatile and speculators are often caught on the wrong side, which leads to sharp swings. Copper prices dropped over 4% last week and bullish sentiment is still too high to suggest that a bottom is forming and there is no technical evidence at this time.
For Freeport-McMoRan Copper & Gold (FCX) and Southern Copper (SCCO), it will be important that the most recent lows do hold.
How to Profit: No new recommendation


