
With the return of volatility, MoneyShow’s Tom Aspray examines what the technicals are saying about this bull market’s health.
As the Dow Industrials moved in and out of positive territory early Tuesday, the market internals stayed clearly positive, which was consistent with the higher daily close. This was enough to cause many of the technical studies, like the McClellan oscillator, to turn higher.
The focus over the past few days has been on the steep drops in many of the high-flying technology and biotech stocks. Even with Tuesday’s bounce, stocks like Facebook, Inc. (FB) are still down close to 20% from their highs. Those who are convinced that this weakness is warning of a sharper decline or a bear market are likely looking to sell a further rally.
Though a more extensive market correction is of course possible, the positive readings from both the weekly and daily NYSE Advance/Decline give no indication that the bull market is over. The sharp drop in the PowerShares QQQ Trust (QQQ) and high-profile stocks has caused an increase in bearish sentiment that I thought the market needed in January. The sentiment has certainly changed since late 2013 as many investors are once again scared of the stock market.
In my opinion, the sideways pattern in the S&P 500 since early March is a pause in the uptrend, not a top. Of course, it is the technical readings that will ultimately determine the market’s next significant move. I see two likely paths for the market, and by early next week, there should be clear evidence of which path is now the most likely. Let’s look at what signs investors and traders should be now looking for in the week ahead.
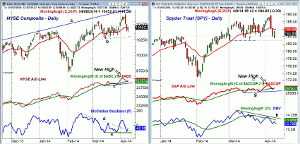
Click to Enlarge
Chart Analysis: The NYSE Composite has dropped below the 20-day EMA over the past two days as it is now down 2% from last Friday’s high.
- There is next support, line b, in the 10,270-10,300 area and the quarterly pivot.
- A decisive break of this level will make the next downside targets in the 9000-10,000 area.
- The NYSE A/D line made a new high last week (see arrow) and has just turned up from its rising WMA.
- This makes the strength of the market internals very important on a further rally.
- A drop in the A/D line below support at line c and the March 26 low would be consistent with a deeper and more prolonged decline.
- The McClellan oscillator dropped to -108 Monday but rose to -48 on Tuesday.
- The break in the oscillator’s downtrend, line d, in late March was consistent with the start of a new uptrend.
- If the support at line e is broken, it will make a drop to more oversold levels the more likely scenario.
- Tuesday’s close was just above the monthly pivot at 10,450 with further resistance now in the 10,500 area.
- A daily close back above 10,622 is needed to signal a resumption of the uptrend.
The Spyder Trust (SPY) dropped to a low of $183.59 on Tuesday as the support zone (line f) was tested.
- A quarterly pivot is at $183.25 and a decisive break below the $182.90 level would signal a drop to the $179-$180 area.
- The weekly starc- band is now at $178.54.
- The S&P 500 A/D line also made a new high last week and has now moved back above its WMA.
- The A/D line has important support now at line g and a break below this level will signal a new downtrend in the A/D line, which would be bearish.
- The daily OBV has been diverging from prices since early March, line h, and is below its declining WMA.
- The weekly OBV made a new high in mid-March and is still holding above its gradually rising WMA; therefore it is still positive.
- The 20-day EMA is now at $185.89 with the monthly pivot at $186.32.
- There is more important resistance now in the $188 to $189.70 area.
NEXT PAGE: A Big Winner & Quick Loser
|pagebreak|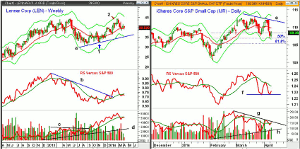
Click to Enlarge
The Lennar Corp. (LEN) has been one of the strongest homebuilding stocks over the past six months and was recommended in early November (point 1).
- The stock peaked at the end of February as it made a high of $44.40 and partial profits were taken at $43.22.
- Five weeks later, it hit a low of $38.35, which was a decline of 13.6% from high to low.
- So far, the 20-week EMA has held on a closing basis and is currently at $39.28.
- It closed last Friday above the new quarterly pivot at $40.13 but is now below it.
- The monthly pivot is a bit higher at $40.76 with last Friday’s high at $41.76.
- The last major swing high on the daily chart is at $42.76 with the monthly projected pivot resistance at $43.16.
- The weekly relative performance moved above its WMA in December and broke its downtrend, line b, in January.
- The RS line did make a new high with prices but is now below its flattening WMA.
- The weekly OBV broke through eight-month resistance, line c, last September and did confirm the recent highs.
- The OBV has also fallen below its WMA but is still well above long-term support at line d.
- The monthly projected pivot support is at $37.21 with the 2014 low at 36.37.
The iShares Core S&P Small-Cap (IJR) was recommended on March 19 but was stopped out with Monday’s drop.
- The drop came very close to the 50% Fibonacci retracement support at $106.57 with the 61.8% support at $105.21.
- The monthly projected pivot support at $107.35 is being tested with the quarterly support at $102.83.
- The close last Friday at $108.98 was above the quarterly pivot at $107.76.
- There is further resistance now at $109.63 to $110.43.
- The daily downtrend, line e, is now at $111.94 with the daily starc+ band at $113.28.
- The daily relative performance peaked on March 18 and is now trying to form a double bottom, line f.
- The weekly RS Line (not shown) is below its WMA.
- The daily OBV rose above its WMA, Tuesday, as the Aspray’s OBV Trigger (AOT) triggered a buy signal.
- The OBV has resistance now at the downtrend, line g, and the previous high.
- The weekly OBV (not shown) is just barely below its WMA.
What It Means: If the market takes the bullish path, then we should get a further rally with strong market internals and any setbacks should be brief.
If instead we get a weak rebound and the futures fail to move above the retracement resistance at 1861-1868, one will need to closely watch the key support in the A/D lines. If this support is broken, then a drop in the SPY to $180 or lower would not be surprising.
Though it is possible that the correction in the iShares Core S&P Small-Cap (IJR) is already over, I would wait for confirmation. The buy levels in the Spyder Trust (SPY) recommended at the end of March have been reached.
The long position in Lennar Corp. (LEN) resulted in over a 22% gain while the iShares Core S&P Small-Cap (IJR) was stopped out with a 4% loss.
How to Profit: No recommendation for now.
Portfolio Update: For the Spyder Trust (SPY) should be 50% long at $186.08 and 50% at $183.96, with a stop at $179.77. Stay tuned to my Twitter feed for updates on this position.
NEXT PAGE: The Charts in Play Portfolio
|pagebreak|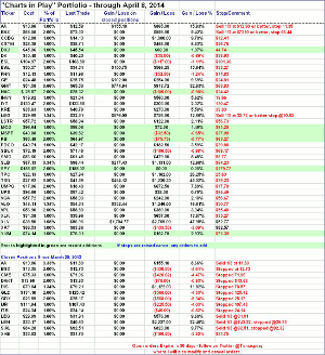
Click to Enlarge


