This year’s outperforming sector has corrected sharply recently, and MoneyShow’s Tom Aspray takes a technical look at another sector that appears ripe for the same scenario.
The strength in the PowerShares QQQ Trust (QQQ) gave the bulls some hope as it was up 0.7% on the day. For the overall market, the close Tuesday, I think, will be more important. The market needs another strong close with positive market internals to support the view that last Thursday’s low will hold.
The PowerShares QQQ Trust (QQQ) needs a strong close above $88.61 to improve its short-term outlook. The McClellan oscillator closed Monday at -8 but needs a close back above +50 to signal a further rally. On the downside, a close in the QQQ below $86.58 would be a short-term negative.
It is not a secret that investors have been chasing yields all year. At the start of May, one of the clear winners was the Select Sector SPDR Utility (XLU) as it was up 15.2% for the year. As I discussed in Is 2014's Hot Sector Ripe for Profit Taking?, at the time, there were technical signs that this sector was vulnerable to profit-taking.
The XLU dropped 1.54% in Monday’s session and is now down 4.37% from the May 1st close. There is another high-yield sector that is now looking vulnerable and the risk is high for investors who buy these stocks now.
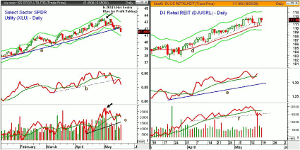
Chart Analysis: The daily chart of the Select Sector SPDR Utility (XLU) shows that Monday’s close was below the daily uptrend, line a, that goes back to the early 2014 lows.
- XLU closed April at the monthly projected pivot resistance at $43.19.
- The initial pullback from the highs held the 20-day EMA but it has since been decisively broken.
- The projected monthly support at $41.60 has now been broken with the 38.2% Fibonacci retracement support from last December’s low at $40.05.
- The 50% support is at $40.02 with the quarterly pivot at $39.96.
- The daily relative performance showed a loss of upside momentum in early May.
- The RS rebounded above its flattening WMA before breaking below the support at line b.
- The daily OBV has dropped below its WMA but is still above support at line c.
- On May, XLU declined sharply on the highest volume of the year (see arrow).
The DJ Retail REIT (DJUSRL) is up 15.3%, so far this year, as it had a high of 113.12 last week. This was just below the quarterly R2 resistance at 113.95.
- The index broke its short-term uptrend, line d, last week.
- It has so far been able to hold above its 20-day EMA, which is at 110.62.
- The daily starc- band is at 109.52 with further chart support at 108.73.
- The 38.2% retracement support from the November lows is at 106.62.
- The relative performance has moved back above its WMA and is well above the support at line e.
- The daily OBV looks much weaker as the volume was high last Thursday.
- The OBV has dropped below its WMA, as well as the support at line f.
- The weekly OBV (not shown) did confirm the recent highs and is well above its rising WMA.
NEXT PAGE: 2 More Vulnerable REITs
|pagebreak|The SPDR Dow Jones Global Real Estate (RWO) has a yield of 3.01% with an expense ratio of 0.50%. It has total holdings of 216 stocks with the top ten making up just over 28% of the ETF. It has 45% in international stocks. The average volume is 150k.
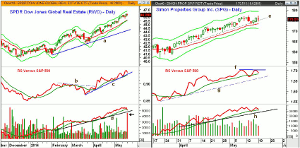
- The chart shows that RWO closed on its high of $46.40 last Friday, which was just below the monthly projected pivot resistance at $46.41.
- The daily starc+ band is at $46.78 with the weekly at $47.34.
- RWO was slightly lower Monday with the rising 20-day EMA now at $45.57.
- The monthly pivot is at $44.66 with the uptrend, line a, at $44.23.
- The relative performance broke through resistance (line b) in early April, which was a positive sign.
- The RS line is still above support, line c, and its rising WMA.
- The daily OBV dropped below its WMA Monday as volume was three times the daily average (see arrow)
- The weekly OBV (not shown) did make a new high last week and is above its WMA.
Simon Properties Group Inc. (SPG) is $54.5 billion retail REIT and is a 6% holding in RWO and a major holding in most REIT ETFs.
- The short-term daily support, line e, was broken last week and SPG formed a doji Monday.
- A daily close in the next three days below $174.61 will trigger a low close doji sell signal.
- Monday’s close was just above the quarterly projected pivot resistance at $174.31.
- The 20-day EMA is at $173.41 with the daily starc- band at $171.15.
- The monthly pivot is at $168.60 with the projected monthly support at $165.28.
- The relative performance has formed lower highs, line f, and declined Monday.
- A drop below its WMA will signal a test of the uptrend, line g.
- The OBV has also turned lower but is above its WMA as volume was not heavy Monday.
- There is more important OBV support at line h. A break of this will likely signal that a correction is underway.
What It Means: Though the REITS show no clear signs of a top, they do look vulnerable to a correction like the utility stocks have recently undergone. If you have nice profits in a REIT, it might be a good idea to take some profits, and in my opinion, the risk is too high to buy them at current levels.
How to Profit: No new recommendation


