As the market rebounded, taking most of the tech sector with it, MoneyShow’s Tom Aspray investigates which tech stocks are likely to participate in a potential upside breakout.
The close Wednesday was impressive as the Spyder Trust (SPY) and the PowerShares QQQ Trust (QQQ) were both able to close above last Thursday’s high. It was also positive that the NYSE Arms Index, which closed Tuesday at 2.04 has dropped back to 0.72, which is consistent with a short-term low. Similar formations were noted at the mid-March and mid-April lows.
The rebound from last week’s lows appeared to have failed on Tuesday, basis the market internals and the daily chart, but prices did not confirm. Another higher close on Thursday will clearly shift the focus back to the upper boundaries of the recent trading range.
Of course, the key question is whether the market will be able to stage a convincing breakout to the upside this time. The repeated breakout failures have made most traders skeptical, so a sustainable move to the upside could catch the majority by surprise.
The Japan’s Nikkei225 was up over 2% overnight while the Euro markets showing slight gains. The US futures are just a bit higher ahead of today new data on manufacturing.
So what stocks or industry groups are likely to participate in a further market rally? Lenovo Group Ltd. (LNVGY) was one of Wednesday’s big gainers as was up 3.73% after reporting a 28.7% increase in yearly net income. Is this a positive sign for the large established technology companies or should one instead look at the semiconductor stocks?
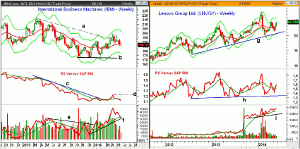
Chart Analysis: In contrast, International Business Machines (IBM) was hit hard in the middle of April as it gapped lower in reaction to a 3.9% decline in 1st quarter revenue.
- The April low was just slightly broken on Tuesday as IBM had a low of $184.70.
- The quarterly pivot at $185.38 is still holding on a weekly closing basis.
- The stock is now trading between the 38.2% Fibonacci support at $187.39 and the 50% support at $184.11.
- The 61.8% support from the early-February low is at $180.83.
- The weekly downtrend, line a, was broken in early April but IBM has since dropped back to its 20-week EMA.
- The chart still shows a potential double bottom formation, lines a and b.
- The weekly relative performance broke its downtrend, line c, in March.
- The RS line needs to move above its recent high, line d, to signal it is a market leader.
- The OBV broke through its resistance (line e) in early January and has formed a solid uptrend.
- It’s WMA is now being tested and a higher weekly close (above $187.06) could trigger an AOT buy signal.
The Lenovo Group Ltd. (LNVGY) dropped to a low of $21.42 in early May before reversing sharply to the upside.
- The early March high of $24.55 is now being tested.
- It closed Wednesday well above its daily starc- band with the weekly at $25.94.
- The high for the year at $27.99 was made in January.
- The relative performance has moved well above its WMA after testing long-term support, line h, in February.
- The daily RS analysis (not shown) suggests that a bottom has been formed.
- The weekly OBV is close to making new highs as there was a large volume surge last September.
- Both the 20-week and 20-day EMA are now in the $22.80 area, which represents good support.
NEXT PAGE: 2 Picks to Buy on Pullback
|pagebreak|The Market Vectors Semiconductor ETF (SMH) has assets of $350 million with 18.4% holding in Intel Corp. (INTC) and 13.2 % holding in Taiwan Semiconductor Manufacturing (TSM).
- It has an average volume of 1.4 million shares and an expense ratio of 0.35%.
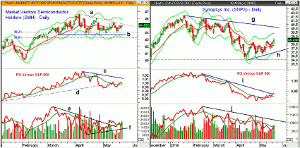
- The daily chart shows an apparent flag or continuation pattern, lines a and b.
- The low of $43.69 on April 28 fell was below the 38.2% Fibonacci support but above the 50% support at $43.21.
- The monthly pivot at $44.98 is now being tested with short-term resistance, line a, at $45.45.
- There is additional resistance at $46.01 with the 127.2% Fibonacci retracement target at $47.34.
- The daily relative performance broke its uptrend, line d.
- The RS line is above its WMA but below stronger resistance at line c.
- The daily OBV broke its downtrend, line e, in early May and moved back above its WMA on Wednesday.
- The OBV has good support now at the uptrend, line f.
- There is minor support now in the $44.50-$44.75 area.
Synopsys Inc. (SNPS) is a $5.93 billion chip design software company that reported earnings yesterday. It missed on revenue but beat on earnings.
- SNPS closed Wednesday above its prior high with the monthly pivot at $37.55
- The quarterly pivot is at $39.24 and SNPS has been below it all quarter.
- The downtrend, line 6, and the weekly starc+ band are in the $40.20- $40.40 area.
- The daily relative performance has just broken its downtrend, line i.
- The RS line is now above its rising WMA.
- The daily OBV made lower lows last week and has now moved above its WMA.
- The weekly OBV moved above its WMA last week and suggests a bottom is in place.
- Minor support at $38-$38.30 with further at $37.40
What It Means: The next few weeks will be important for International Business Machines (IBM) as it needs a weekly close above $193.40 to signal the correction is over.
The chart of Lenovo Group Ltd. (LNVGY) looks strong but I see no good entry given the recent price action.
For both Market Vectors Semiconductor ETF (SMH) and Synopsys Inc. (SNPS), the risk looks favorable on buying on a slight pullback.
How to Profit: For Market Vectors Semiconductor ETF (SMH), go 50% long at $44.86 and 50% at $44.48, with a stop at $43.49 (risk of approx. 2.6%).
For Synopsys Inc. (SNPS), go 50% long at $38.23 and 50% at $37.58, with a stop at $36.43 (risk of approx. 3.8%).


