The market has quite a bit of economic data to overcome in this shortened week, so MoneyShow's Tom Aspray reviews the four NYSE stocks with the highest short interest ratios to see if their technical readings favor short covering rallies.
Stocks are a bit lower in early Monday trading yet the global markets seem set on recording their fourth consecutive positive quarter. The MSCI World Index is up over 4% in the second quarter as it tracks stocks in 45 different countries.
The strong readings from the weekly technical studies, as reviewed on Friday, show no signs yet of a significant top, though the S&P 500 did form a weekly doji last week. A close this Thursday below 1944.69 would trigger a weekly low close doji sell signal.
The last day of the quarter could elicit some last minute buying by underinvested portfolio and hedge fund managers as they struggle not to underperform their benchmarks for the second quarter in a row.
The market will have lots of economic data to overcome this week, starting today with the Chicago PMI, Pending Home Sales Index, and the Dallas Fed Manufacturing Survey. Last week's data reflected a more positive consumer outlook. Some of the consumer related ETFs could breakout to the upside this week, be sure you know what is inside your ETF before you buy.
The most recent data on short interest from the NYSE was released last week and this data should be monitored not only for positions you own, but those you are considering. When a stock has a positive technical outlook and a very high short interest, the combination can be explosive. Here are the four NYSE stocks with the highest short interest ratios.
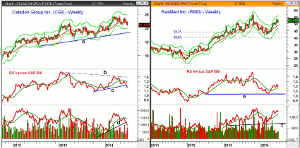
Chart Analysis: Celadon Group, Inc. (CGI) is a $496 million dry van truckload carrier that is 14.2% below its 52-week high but still up 8.9% YTD.
- CGI has a whopping short interest ratio of 117. This means that it will take that many days to cover the outstanding short position of 20.731 million shares based on the average daily volume of 177K.
- The weekly chart shows that CGI broke out to the upside early in the year reaching a high of $24.65.
- The correction looks fairly normal, so far, with the weekly starc- band at $19.82.
- The monthly projected pivot support for July is at $19.16 with weekly support at $18.16, line a.
- The relative performance did not confirm the new price highs in 2014 and has now broken its uptrend, line c.
- The OBV also shows a rally failure as it moved above its WMA in May but then quickly reversed to the downside.
- The break of the uptrend in the OBV, line d, does allow for a further decline.
- The tentative third quarter pivot is at $22.29 with further resistance at $22.79.
ResMed, Inc. (RMD) is a $7.4 billion developer and distributer of medical equipment to treat/diagnose sleep disordered breathing. It is down 8.5% from its 52-week highs.
- It has a short interest ratio of 60 as 31.927 million shares have been sold short.
- This in an increase of about 400K shares since the last report and the short interest ratio has broken out to the upside (Nasdaq.com chart).
- The weekly chart shows that RMD dropped down into the 38-50% Fibonacci support zone.
- RMD has had an impressive rally from the February lows with the monthly pivot now at $50.14.
- It is well above its rising 20-week EMA at $49.11 with monthly projected pivot support at $46.11.
- The relative performance is positive as it is well above its rising WMA after testing support at line e.
- The weekly OBV also tested good support before moving back above its WMA.
- The WMA is clearly rising with the daily OBV (not shown) also now clearly positive.
- Once above the June high at $53.92 there is projected pivot resistance at $56.43.
- RMD was the focus of a cautionary article in this week's Barron's as changes in government payment process for medical equipment could hurt its bottom line.
NEXT PAGE: 2 More Stocks with Short Interest Ratios
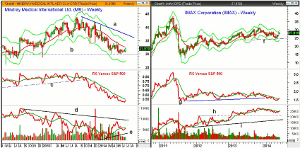
|pagebreak|Mindray Medical International Ltd. (MR) is a $3.8 billion medical device company, which is 27% below its 52-week high of $43.81.
- Its short interest ratio is 51.4, up from 40 at the end of May.
- MR has been below its declining 20-week EMA for most of the year.
- It has tested the 61.6% Fibonacci retracement support, calculated from the August 2011 lows.
- It did trigger a weekly HCD last week with key support now at $29.94.
- The weekly RS line broke major support, line c, in late 2013 and has since stayed below its WMA.
- The on-balance volume (OBV) turned higher last week but is still below its WMA.
- It weekly OBV does show a short-term uptrend, line e.
- The daily OBV (not shown) is positive after Friday's 3% gain.
- The quarterly pivot is at $32.15 with monthly projected pivot resistance at $34.36.
IMAX Corporation (IMAX) is a well known $1.9 billion entertainment technology company, which is 10.6% below its 52-week high. It is down 5.3% YTD.
- It has a short interest ratio of 50 as there are 15.985 million shares sold short with an average daily volume of 321K.
- IMAX is up 9.8% in the past month as it has bounced from the important support at $24.47, line f.
- The RS line dropped below long-term support, line g, early in the year, but has just moved slightly above its WMA.
- The weekly OBV does look stronger as it has held well above its breakout level at line h.
- The OBV has even stronger support at line i.
- There is next resistance at $28.84 with the monthly projected pivot resistance at $30.40.
- The late 2013 high was $31.23 while IMAX made a high of $38 in 2011.
What it Means: The overall increase in both the NYSE and Nasdaq short interest as of June 13 is a positive for the market. The next reading on July 10 could be quite interesting.
Though the article on Barron's could cause some selling in ResMed, Inc. (RMD), it does look the best technically and would consider the long side on a pullback.
Mindray Medical International Ltd. (MR) could generate new weekly buy signals in the next week or two. If it does, then it will need to be examined for a good entry point using some the techniques discussed in last week's Advanced Entry Techniques for Any Market.
How to Profit: No new recommendation.


