
The sharp rally in many of the consumer discretionary stocks last week could mean a better than expected Retail Sales report on Wednesday, so MoneyShow’s Tom Aspray examines the charts of three stocks in this emerging sector to determine if they could be new market leaders.
The strong close in the US Markets last Friday has spurred further buying overseas as Japan’s Nikkei regained half of last Friday’s drop. European stocks are also higher with the German Dax up over 1%. The US futures are also showing nice gains in early trading.
The continuation of the rally—that was signaled last Thursday by the technical studies—is likely to reassure some investors. Convincing anyone to buy stocks in August is always a tough sell. The sharp decline in yields does not make the choice any easier. The fund flows indicate that investors are moving out of stocks as well as junk bonds.
The daily technical studies do not yet suggest that the market has bottomed despite some evidence of a high level of fear amongst investors. The sharp rally in many of the consumer discretionary stocks last week could mean a better than expected Retail Sales report on Wednesday.
My weekly volume scan turned up three stocks in this emerging sector that already are being accumulated and appear to be new market leaders.
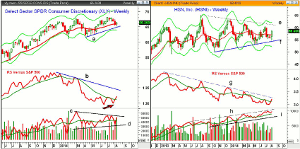
Click to Enlarge
Chart Analysis: The Select SPDR Consumer Discretionary (XLY) has been one of the worst performing sector ETFs for the year as it is down 0.07% YTD.
- It has done better over the past few months as XLY is up 4.86% over the past three months versus 3.46% in the SPY.
- The low last Thursday at $65.16 tested the quarterly pivot at $65.28.
- The recent correction dropped XLY just between the 38.2% ($65.64) and the 50% ($64.87) Fibonacci retracement support from the April lows.
- The weekly uptrend from the early 2014 lows, line a, appears to have held.
- The relative performance formed a negative divergence at the March highs, line b.
- The RS line has formed higher lows (see arrow) and has now moved back above its WMA.
- A higher close this week in the RS will confirm the bottom formation.
- The volume increased last week and the OBV has moved back above its WMA.
- A move in the OBV above resistance, at line c, will confirm the bottom formation.
HSN, Inc. (HSNI) is a $3.06 billion online specialty retail company that is down 5.46% YTD but up just over 7% in the past three months.
- HSNI reported a 5% drop in 2nd quarter earnings last week but beat on revenues.
- The weekly chart shows that HSNI dropped below the prior ten week lows last week before closing higher.
- The low at $54.40 came quite close to the weekly uptrend, line f.
- Last’s Friday’s close was above the quarterly pivot at $57.68 with next resistance in the $60 area.
- The weekly starc+ band is at $62.06 with the quarterly pivot resistance at $62.68.
- The weekly RS line has moved above is WMA but is still below resistance at line g.
- The weekly on-balance volume (OBV) has been forming higher highs, line h, since 2013.
- The OBV has turned up from its WMA with further support at line i.
- With last Thursday’s sharp rally there is minor support now at $57.20.
- The 20-day EMA support is at $56.74 and with further at $56.
NEXT PAGE: Two More Retail Stocks to Watch
|pagebreak|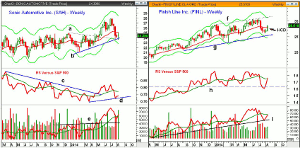
Click to Enlarge
Sonic Automotive, Inc. (SAH) is a $1.28 billion auto retailer that also missed on earnings in the latter part of July. It is down 0.16% YTD and is 12.5% below its 52-week high.
- Three week’s ago, SAH dropped to the weekly starc- band and had a low last week of $23.61.
- This was just above the quarterly projected pivot support at $23.51.
- The converging support on the weekly chart, lines a and b, was tested.
- The weekly starc- band is at $22.74.
- The relative performance broke it downtrend, line c, in May.
- The RS line dropped sharply from its high and is back below its WMA.
- The daily RS analysis (not shown) does appear to have bottomed.
- The weekly OBV broke through major resistance, line e, last May.
- The OBV did confirm the recent highs and moved back above its WMA last week.
- This generated at AOT buy signal.
- The 20-day EMA is at $24.89 with the quarterly pivot at $25.48.
Finish Line, Inc. (FINL) is a $1.06 billion specialty retailer of athletic shoes and accessories with a yield of 1.06%. It is up just 1.77% YTD and 1.24% YTD.
- The weekly chart shows that FINL triggered a HCD buy signal last week.
- The close was well above the 20-week EMA at $27.86.
- The recent low at $26.16 briefly violated the quarterly projected pivot support at $26.58.
- The weekly uptrend, line g, is at $25.32 with the weekly starc- band at $24.46.
- The RS line has turned up sharply from support at line h, and closed Friday back above its WMA.
- The daily RS analysis (not shown) has clearly bottomed.
- The weekly OBV has turned up from the long-term uptrend, line i.
- It is still below its WMA but the daily OBV looks strong.
- The rising 20-day EMA is at $27.55 with further support at $26.60-$26.80.
What it Means: These three specialty retailers are flying under the radar of most analysts and have been lagging the S&P 500 all year.
The least volatile recommendation is in the SPDR Consumer Discretionary (XLY) if you are not already long XLY as previously recommended.
Both HSN, Inc. (HSNI) and Sonic Automotive, Inc. (SAH) have a lower risk and better entry opportunity than Finish Line, Inc. (FINL).
How to Profit: Those not already long, SPDR Consumer Discretionary (XLY) at $66.11 and 50% at $65.44 with a stop at $63.87 (risk of approx. 2%).
For HSN, Inc. (HSNI) go 50% long at $57.27 and 50% at $56.76 with a stop at $54.17 (risk of approx. 5%).
For Sonic Automotive, Inc. (SAH) go 50% long at $24.24 and 50% at $23.66 with a stop at $23.13 (risk of approx. 3.5%).
For Finish Line, Inc. (FINL) go 50% long at $28.09 and 50% at $27.56 with a stop at $26.47 (risk of approx. 4.9%).
Portfolio Update: Should be 100% long the Select SPDR Consumer Discretionary (XLY) at $63.92, with a stop now at $62.87.


