Those looking to buy stocks in some of the unloved industry groups may want to first determine if they are starting to become new market leaders before they buy, says MoneyShow's Tom Aspray.
Asian markets were mixed Monday but the buyers appear to have taken over as many of the Euro markets are up over 1% in early trading. The US futures are also acting strong in early trading.
After last week's action only the Nasdaq 100 A/D line was able to signal that the correction was over. All of the other major averages are now testing strong resistance levels with short-term support to watch at last Friday's lows.
The sentiment picture is mixed as-while the individual investors turned more bullish last week-there are signs that the institutional strategists and fund managers have turned more negative on stocks. They are recommending a relatively low commitment to stocks which, in the past, has correlated with stock market bottoms.
There is a full economic calendar this week culminating with the Fed Symposium at Jackson Hole on Friday where Fed Chair Janet Yellen and ECB President Mario Draghi are scheduled to speak.
If the stock market is close to completing its correction, which industry groups or sectors will lead the market higher? Some are looking to the money center or regional banks that offer higher yields that the 10-Year T-Notes but is now the time to buy?
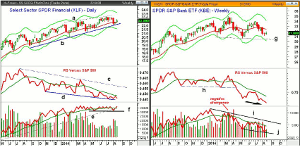
Chart Analysis: The Select Sector Financials (XLF) has just slightly underperformed the Spyder Trust (SPY) over the past three months.
- On a YTD basis, the XLF is up 4.08% versus a 6.98% gain in the SPY.
- The weekly uptrend, line a, was tested two weeks ago as it is trying to hold the quarterly pivot at $22.26.
- On a drop below the recent low of $22.08, the weekly starc- band is at $21.57.
- A weekly close above $23.10 will signal a rally to the quarterly projected pivot resistance at $24.08.
- The relative performance has been below its WMA since early April.
- The RS line shows a pattern of lower lows, line c, which is consistent with a sector that is weaker than the market.
- The weekly OBV is acting much better as it moved back above its WMA last week.
- The OBV has regained the uptrend from the 2013 lows (line e) and has held near term support at line f.
- The volume last Friday was the heaviest of the week.
The SPDR S&P Bank ETF (KBE) has 70% of its assets in regional banks and is up only 1.94% over the past three months. It has a current yield of 1.45% with an expense ratio of 0.35%.
- On a YTD basis, it is down 4.08%, slightly over 11% worse than the SPY.
- Two week's ago, KBE formed a doji but it failed last week to close above the doji high of $31.69.
- The 20-week EMA is now at $32.40 with the quarterly pivot at $32.82.
- The weekly chart shows that there is important support, line g, in the $30.60 area.
- The relative performance completed its top formation at the end of April as the eight month support, line h, was broken.
- The RS line has been forming lower lows (see arrow).
- The weekly OBV formed a negative divergence at the March high of $34.91.
- The divergence was confirmed in early May as the February support was violated.
- The OBV has since formed lower lows as it has stayed below its declining WMA.
- A weekly close above $34 is needed to turn the weekly chart around.
NEXT PAGE: Two More Bank Stocks to Watch
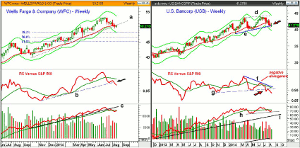
|pagebreak|Wells Fargo & Company (WFC) has closed below its uptrend, line a, for the past two weeks.
WFC outperformed the SPY by 5.8% YTD but is lagging over the past three months.
- WFC is now down 5.41% from its 52-week high of $53.08.
- The weekly starc- band is at $48.12 with the 38.2% Fibonacci support at $47.56.
- There is more important support in the $45-$47 area.
- The relative performance did confirm the June highs but dropped below its WMA in early July.
- The support at line b has now been broken as the RS line is in a downtrend.
- The weekly on-balance volume (OBV) broke its uptrend, line c, on Friday July 11.
- The OBV turned up last week but is still below its WMA.
- The daily OBV (not shown) is still below its WMA.
- The monthly pivot is at $51.27 with more important resistance at $51.94.
US Bancorp (USB) has been lagging the SPY all year as it is now up just 3.33% YTD and is down 4.7% in the past month.
- USB closed on the chart support at line e, with the quarterly projected pivot support at $40.74.
- The May lows in the $39.60-$39.80 area represent more important support.
- The relative performance diverged from prices at the June highs, line f.
- The divergence was confirmed when the RS line dropped below the support at line g.
- The daily RS analysis (not shown) is also negative as it has formed lower lows.
- The weekly OBV has turned up from short-term support at line h, but is still below its WMA.
- There is more important OBV support at line i.
- The quarterly pivot is at $42.21 with stronger resistance at $43.10, which was the late July high.
What it Means: The weekly relative performance analysis of the financial sector and banks continues to indicate they will underperform the S&P 500. Though the weekly OBV does look better, there are no strong positive signals yet from the daily studies.
Wells Fargo & Company (WFC) has a current yield of 2.59% while US Bancorp (USB) yields a bit less at 2.27%. Both still have negative weekly and daily RS analysis which-in the current difficult market-outweighs the positive weekly OBV to buy for growth.
They are probably a reasonable yield play given the improvement in the overall market outlook.
Their dividends seem secure but one needs to risk to under the 1st quarter low for USB and the 2nd quarter low for WFC.
How to Profit: No new recommendation.


