As earnings season approaches, there are signs the financial sector may be becoming a market leader, so MoneyShow's Tom Aspray takes a technical look at two ETF recommendations and two large banks to determine what to expect next.
The rally early Monday fizzled by the close and the EuroZone markets have also reversed to the downside early Tuesday. The market internals were neutral so the previously mentioned bullish divergence in the McClellan oscillator (see chart) has not been confirmed yet.
The stock market is nervously waiting for the start of earnings season after the close Wednesday when Alcoa, Inc. (AA) starts the ball rolling. Many will be waiting for the earnings from financial giants like Citigroup Inc. (C), JPMorgan Chase (JPM), and Goldman Sachs (GS) next week.
In last month's Finding the Sweet Spot in the Financial Sector I alerted traders and investors to the signs that the financial sector was becoming a market leader. A look at two of my ETF recommendations from that article as well as two of the largest banks can give you some insight on what to expect next week.
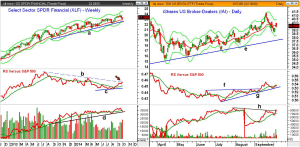
Chart Analysis: The Select Sector Financials (XLF) dropped below its 20-week EMA last week closing above the quarterly pivot at $23.01.
- XLF is now up 7.43% YTD.
- There is next resistance at $23.50-$23.70 with the projected monthly pivot resistance at $24.20.
- The weekly starc+ band is now at $24.42.
- There is short-term support at last week's low of $22.74 and the projected monthly support at $22.85.
- The weekly relative performance formed a bottom over the summer, line c.
- The daily RS (not shown) made a new high last Friday and continues to act strong.
- This has been confirmed over the past month as the downtrend, line b, has now been broken.
- The weekly OBV closed the week below its WMA as the uptrend, line d, has been tested.
- The daily OBV needs a higher close in the next few days to complete its bottom formation.
The iShares US Broker-Dealers (IAI) came close to its daily starc- band last week but closed Monday just above its 20-day EMA.
- It is above the quarterly pivot at $38.88 with last week's low at $38.67.
- The monthly projected pivot support is at $38.20 with the daily uptrend, line e, at $37.66.
- The daily relative performance completed its bottom formation in September as the resistance at line f, was overcome.
- The support for the RS, line g, was tested last week.
- The daily OBV is trying to break above the resistance at line h.
- The volume was heavy last Friday as prices moved higher.
- The weekly studies (not shown) are both clearly positive.
- There is next resistance at $40.57 with the projected quarterly pivot resistance at $42.26.
Next Page: Two Large Banks to Watch
|pagebreak|
Citigroup, Inc. (C) came close to its weekly starc- band three weeks ago. It reports earnings on Tuesday October 14.
- The monthly projected pivot support at $50.58 was tested last week before it rebounded to close higher.
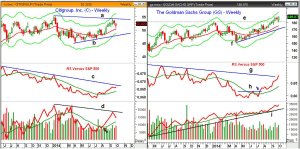
- There is next resistance at $53.32 with the September high at $54.13, line a.
- The monthly projected pivot resistance is at $55.37 with the weekly starc- band at $56.32.
- The weekly relative performance moved above its WMA in July and completed its bottom in August.
- A break of the weekly downtrend, line c, will confirm it is a market leader.
- The weekly OBV pulled back from the September highs but is still well above its WMA.
- There is OBV resistance at line d.
- The daily OBV (not shown) has turned up but is still below its WMA.
The Goldman Sachs Group (GS) broke out to new highs for the year (line e) on September 12. It is up 10.96% in the past three months but just 6.70% YTD.
- The monthly projected pivot resistance is at $194.88 with the weekly starc+ band at $195.45.
- On Friday, GS gapped back above its 20-day EMA, which is now at $183.62.
- There is initial weekly support at $180.33, which was last week's low.
- The monthly projected pivot support is at $177.27 with the September low at $176.62.
- The weekly RS completed its bottom formation on July 18 as the resistance at line h, was overcome.
- This was confirmed by the move in the relative performance above its downtrend, line g.
- The OBV has been strong since late August and has surged sharply over the past five weeks.
- The daily on-balance volume (OBV) (not shown) is just barely below its WMA.
What it Means: As has been the rule for a number of years, analysts are lowering their earning forecasts as we head into the new season. Since July, the forecast for 3rd quarter earnings has dropped over 4%.
This protects some companies against earning disappointments but those stocks like Goldman Sachs Group (GS) with strong weekly technical readings are more likely to surprise on the upside. Some of the oversold Dow stocks I reviewed Monday could use a good earnings report to reverse their current downward trend.
How to Profit: No new recommendation.


