Some stocks in the process of bottoming are likely to diverge from the overall market, so MoneyShow’s Tom Aspray further analyzes the scan of the Nasdaq 100 stocks to isolate those that look the most promising technically.
The stock market’s ability to close higher last week has improved the weekly technical outlook but the volume is still not confirming the price action. Nevertheless, the short-term momentum is positive as we enter a two-week seasonal period where stocks are generally weak.
The PowerShares QQQ Trust (QQQ) is still a market leader as it is up over 18.2% YTD compared to just a 12.1% gain in the Spyder Trust (SPY). As I outlined in Friday’s Week Ahead column Two Potential Stock Market Scenarios, there are two paths for the stock market that I think are the most likely for the next few weeks.
Whether the market sees a sharp setback or a period of sideways consolidation, there are some stocks that are just in the process of bottoming and are likely to diverge from the overall market. Therefore, I continue to run my regular weekly scans to find those stocks that look the most promising.
One of the scans focused on the Nasdaq 100 stocks as I first looked for those stocks where the OBV was above its WMA. For the Nasdaq 100, there were 58 stocks that met this criteria.
This group of stocks was then analyzed further to isolate those where the daily OBV has just moved above its WMA. These stocks had, therefore, just triggered a buy signal from Aspray’s OBV Trigger (AOT).
Only nine of the 58 stocks passed this test. I then examined these stocks basis their charts and relative performance analysis. Here are three that looked the most interesting.
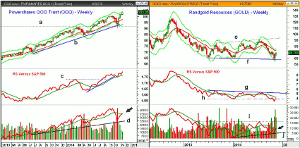
Chart Analysis: The PowerShares QQQ Trust (QQQ) closed last week at $103.21, which is just barely below the weekly starc+ band at $103.91.
- The quarterly projected pivot resistance is at $104.74, and in the 3rd quarter, the QQQ came close to the quarterly resistance before the October decline.
- There is initial weekly support now at $100-$100.67, which also corresponds to the 20-day WMA.
- There is more important support at the quarterly pivot, which stands at $97.59.
- The relative performance closed the week at a new high, further confirming the QQQ as a market leader.
- The RS line broke through major resistance, line c, in July.
- The weekly OBV just moved back above its WMA last week.
- The daily OBV (not shown) is well above its WMA and confirming the price action.
A surprising stock that showed up in the scan was Randgold Resources (GOLD), a $6.7 billion sub-Saharan gold mining company.
- It has clearly been diverging from gold prices as hedge funds cut their long futures and option positions by 14% last week.
- GOLD is up 10.2% YTD, while the SPDR Gold Shares (GLD) is down 1.4%.
- The weekly chart shows that GOLD has formed lower lows, line f, going back to 2013.
- GOLD came close to its weekly starc- band three weeks ago.
- The relative performance did drop below support (line h) at the November lows.
- A move in the RS above the resistance at line g, is needed to signal that it is a market leader.
- The weekly on-balance volume (OBV) has formed a long-term bullish divergence, line j, that goes back to the early 2014 lows.
- The OBV is back above its WMA and has key resistance at line i.
- The 20-day EMA is at $65.14 with the monthly pivot at $62.37.
NEXT PAGE: Two More Interesting Stocks to Watch
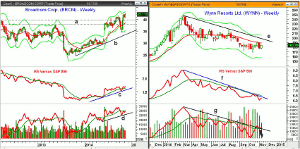
|pagebreak|Broadcom Corp. (BRCM) made new highs for the year on Friday as it closed not too far below the weekly starc+ band at $43.42.
- The long-term chart shows a basing formation going back to 2002 (I will Tweet later) with key resistance at $44.97 to $47.41.
- A move above this major resistance could complete a long-term bottom as BRCM peaked at over $173 in 2000.
- The weekly chart shows a band of good support in the $37.80 to $39.80 area, line a.
- This also corresponds to the quarterly pivot ($39.50) and quarterly support ($37.36).
- The weekly chart shows a strong uptrend (line b) that goes back to the 2013 lows.
- The weekly RS line also shows a solid uptrend, line c, consistent with a market leader.
- The RS line is also above its WMA.
- The OBV now shows a short-term uptrend, line d, as it has just moved back above its WMA.
Wynn Resorts Ltd. (WYNN) has held up well despite reporting a decrease in revenues in September. This was mainly tied to lower revenues from Macau and the stock is down 2% YTD.
- The weekly chart shows a well established downtrend from the early 2014 highs, line e.
- This decline has dropped the stock into the 38.2-50% support of the rally from the July 2012 lows.
- The 20-day EMA is at $189.70 with further weekly resistance at $192.45.
- The weekly relative performance also shows a well established downtrend, line f.
- The RS line turned up last week but is still below its WMA.
- The weekly OBV looks more positive as it has broken its downtrend, line g, and moved above its WMA.
- The daily OBV (not shown) is still negative.
- There is initial support now at $178-$180 area with stronger at $176.50.
- A drop below the 168.80 level would abort the bottom formation.
What it Means: All three of these stocks should be watched even though the Powershares QQQ Trust (QQQ) is in a high risk buy area. My recent analysis of gold and the gold miners suggested it would take several weeks or more before they could bottom.
Last Friday’s sharp rally was impressive, but would wait for weekly/daily confirmation of a bottom for the whole industry before buying Randgold Resources (GOLD).
I will be watching both Broadcom Corp. (BRCM) and Wynn Resorts Ltd. (WYNN) for a good entry points.
How to Profit: No new recommendation.


